Fig. 7.
Download original image
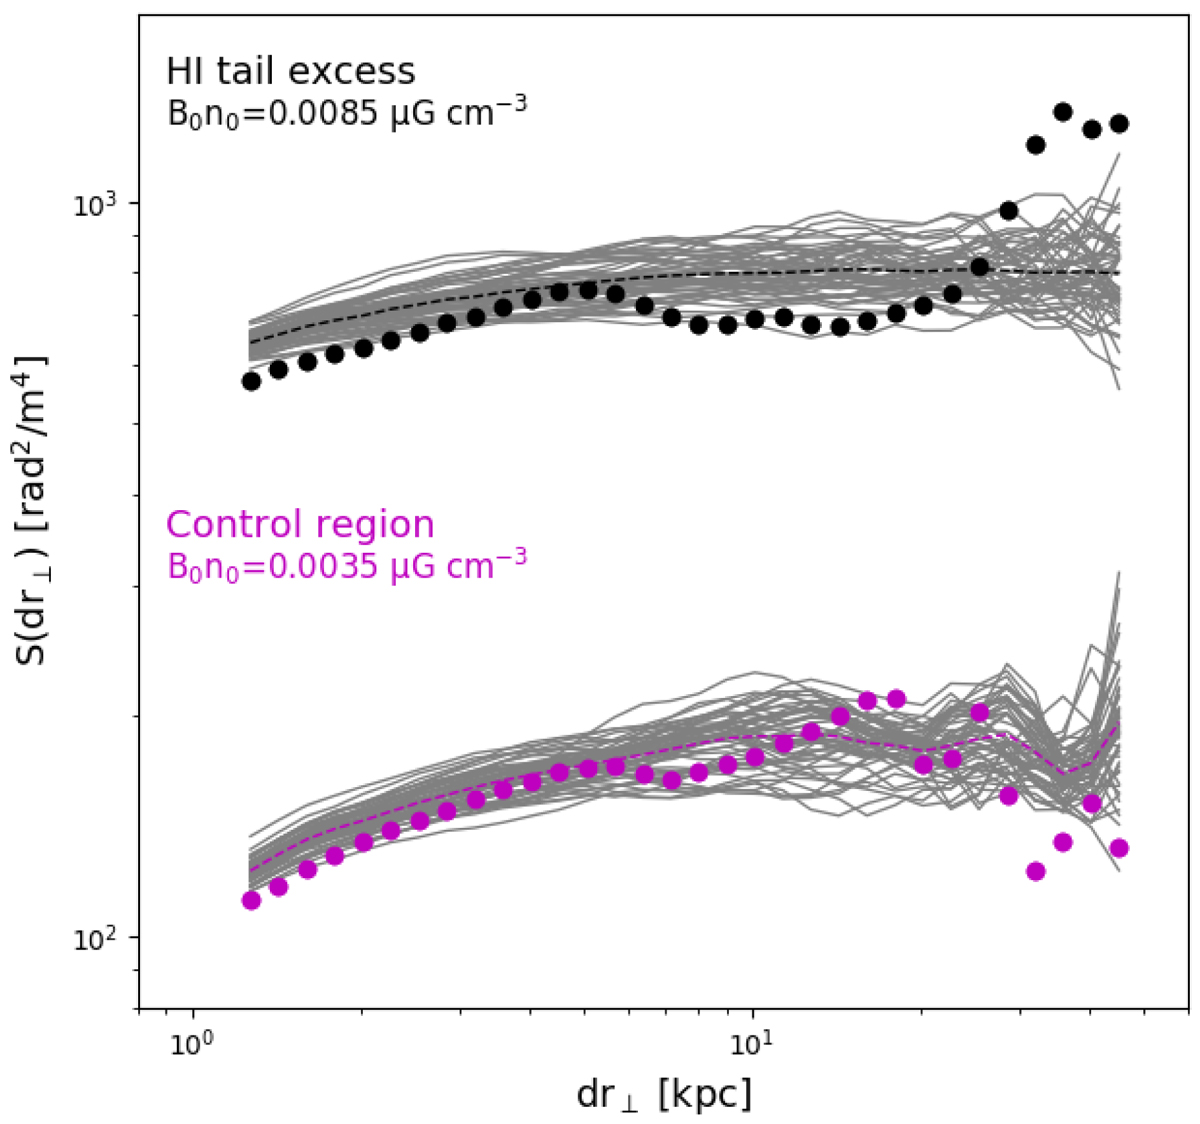
RM structure functions evaluated in the H I tail (black) and in the control region (magenta). The gray lines near the control region are the best-fit simulated RM structures reported in Fig. 6. Those near the H I tail region are best-fit models for the H I tail excess obtained considering that the observed RM at the H I position is due to the intrinsic H I tail contribution plus the RM model of the control region. The best-fit parameters are reported on the left.
Current usage metrics show cumulative count of Article Views (full-text article views including HTML views, PDF and ePub downloads, according to the available data) and Abstracts Views on Vision4Press platform.
Data correspond to usage on the plateform after 2015. The current usage metrics is available 48-96 hours after online publication and is updated daily on week days.
Initial download of the metrics may take a while.