Free Access
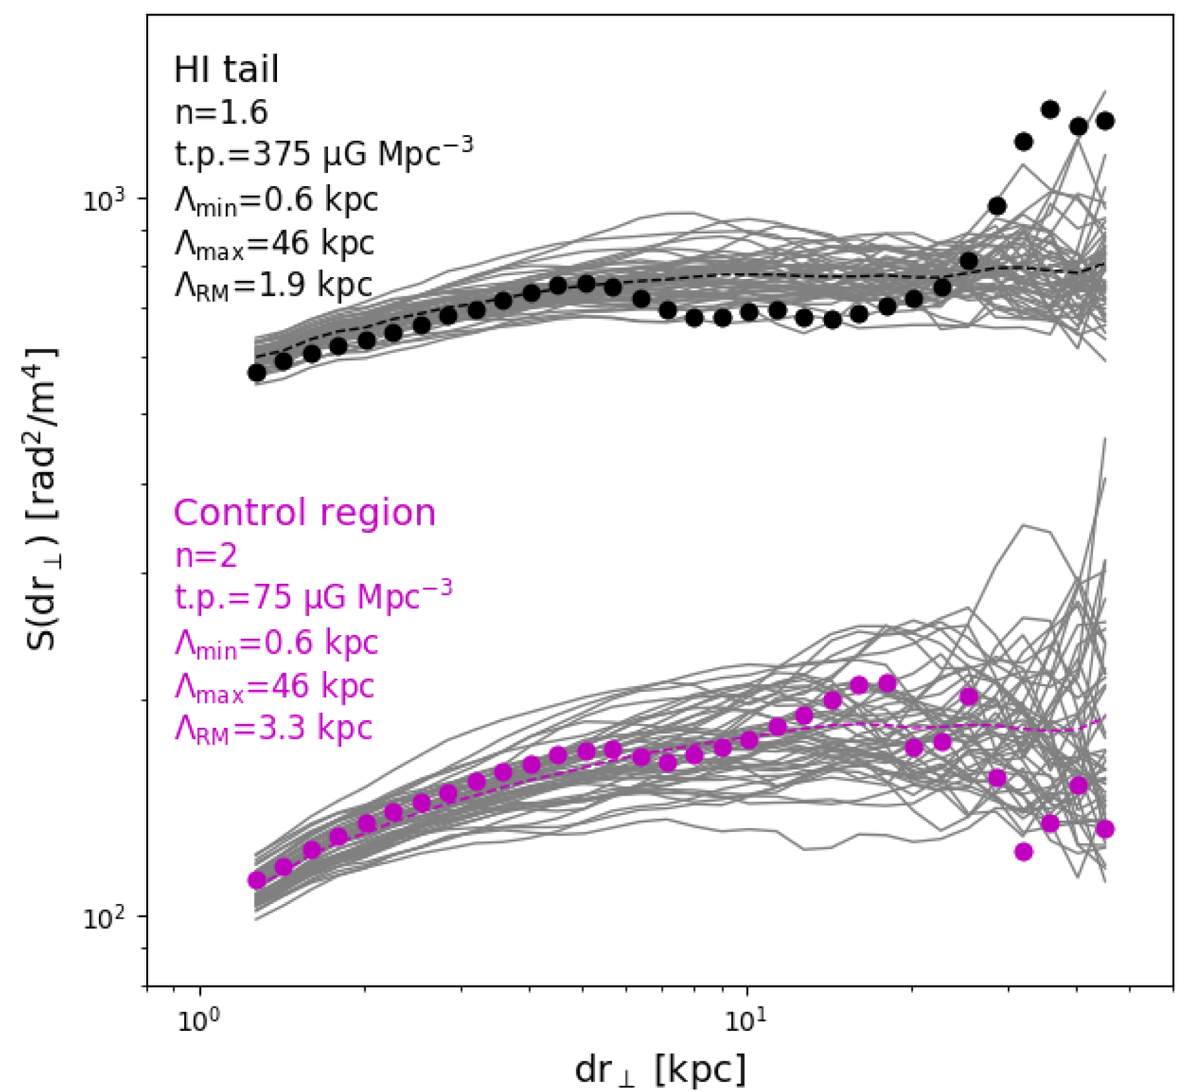
Fig. 4.
Download original image
RM structure functions evaluated in the H I tail (black) and in the control region (magenta). The gray lines are, for each RM structure function, 50 simulated functions generated from magnetic field power-law power spectrum models with parameters reported on the left.
Current usage metrics show cumulative count of Article Views (full-text article views including HTML views, PDF and ePub downloads, according to the available data) and Abstracts Views on Vision4Press platform.
Data correspond to usage on the plateform after 2015. The current usage metrics is available 48-96 hours after online publication and is updated daily on week days.
Initial download of the metrics may take a while.