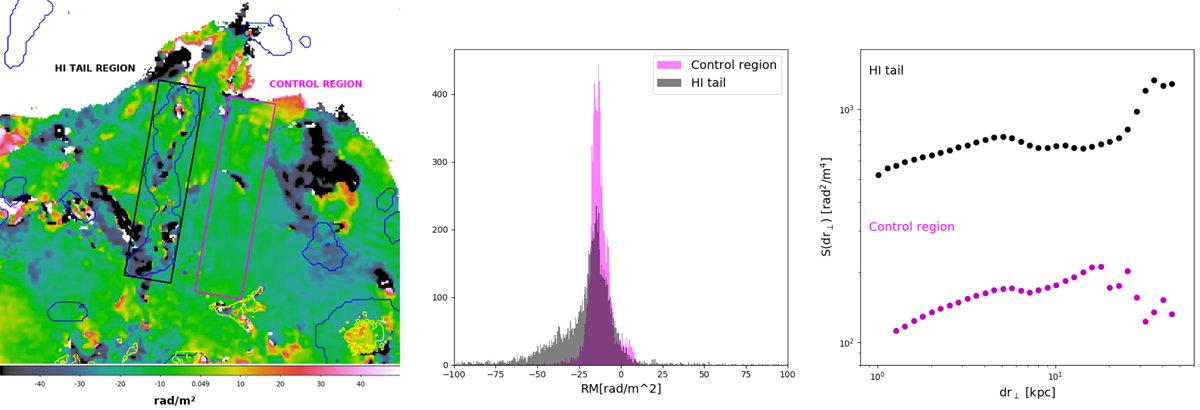
Fig. 3.
Download original image
RM images and properties of the H I tail and in a nearby region. Left: magnified RM image with VST Hα contours (yellow) and MeerKAT H I contours (blue). The black and magenta boxes indicate the H I tail and control regions considered in our analysis. Middle: distribution of the RM values in the H I tail (black) and in the control region (magenta). Right: RM structure functions evaluated in the H I tail (black) and in the control region (magenta).
Current usage metrics show cumulative count of Article Views (full-text article views including HTML views, PDF and ePub downloads, according to the available data) and Abstracts Views on Vision4Press platform.
Data correspond to usage on the plateform after 2015. The current usage metrics is available 48-96 hours after online publication and is updated daily on week days.
Initial download of the metrics may take a while.