Fig. 1.
Download original image
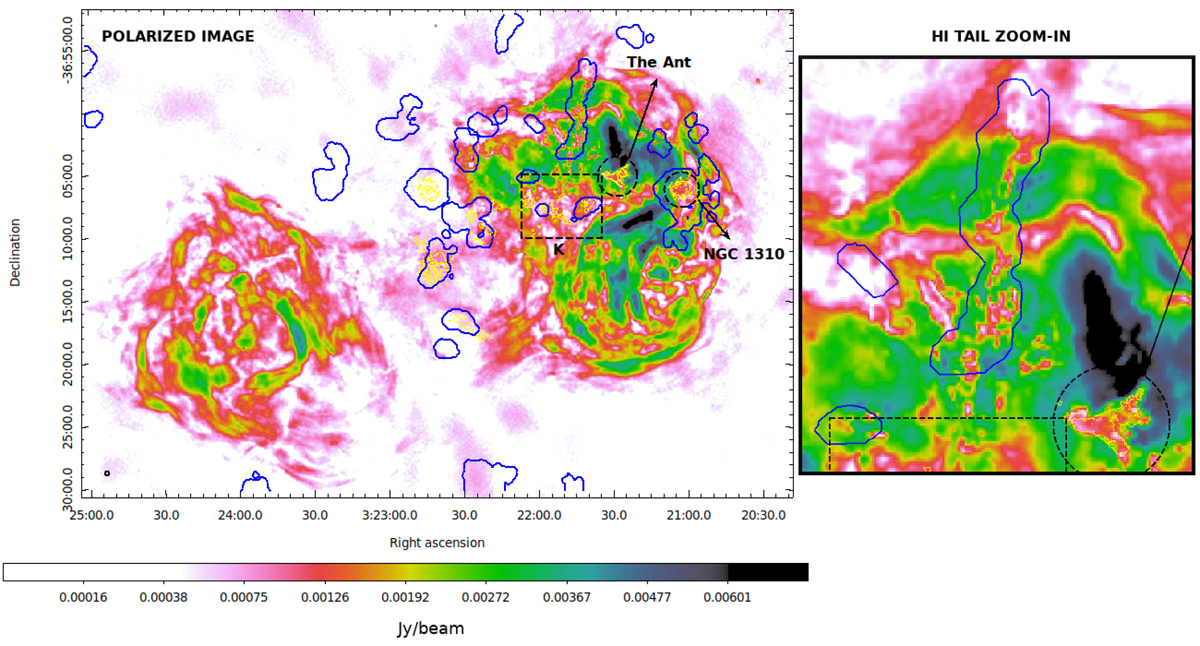
ASKAP polarized image (defined as the peak of the Faraday dispersion function) and, on the right, a zoomed image centered on the southern part of the H I tail. The beam size is shown in the bottom left corner of the image; its FWHM corresponds to 12″. In both images VST Hα and MeerKAT H I contours are overlaid in yellow and blue, respectively. The Hα contour starts at 2 × 10⁻¹⁸ erg cm−2 s−1 arcsec−2, while the H I contour represent a column density of NH I = 1.4 × 10¹⁹ atoms cm−2. The black dashed regions and arrows indicates the position of NGC 1310, of the Ant, and the region labeled “K” in Anderson et al. (2018b).
Current usage metrics show cumulative count of Article Views (full-text article views including HTML views, PDF and ePub downloads, according to the available data) and Abstracts Views on Vision4Press platform.
Data correspond to usage on the plateform after 2015. The current usage metrics is available 48-96 hours after online publication and is updated daily on week days.
Initial download of the metrics may take a while.