Fig. 1.

Download original image
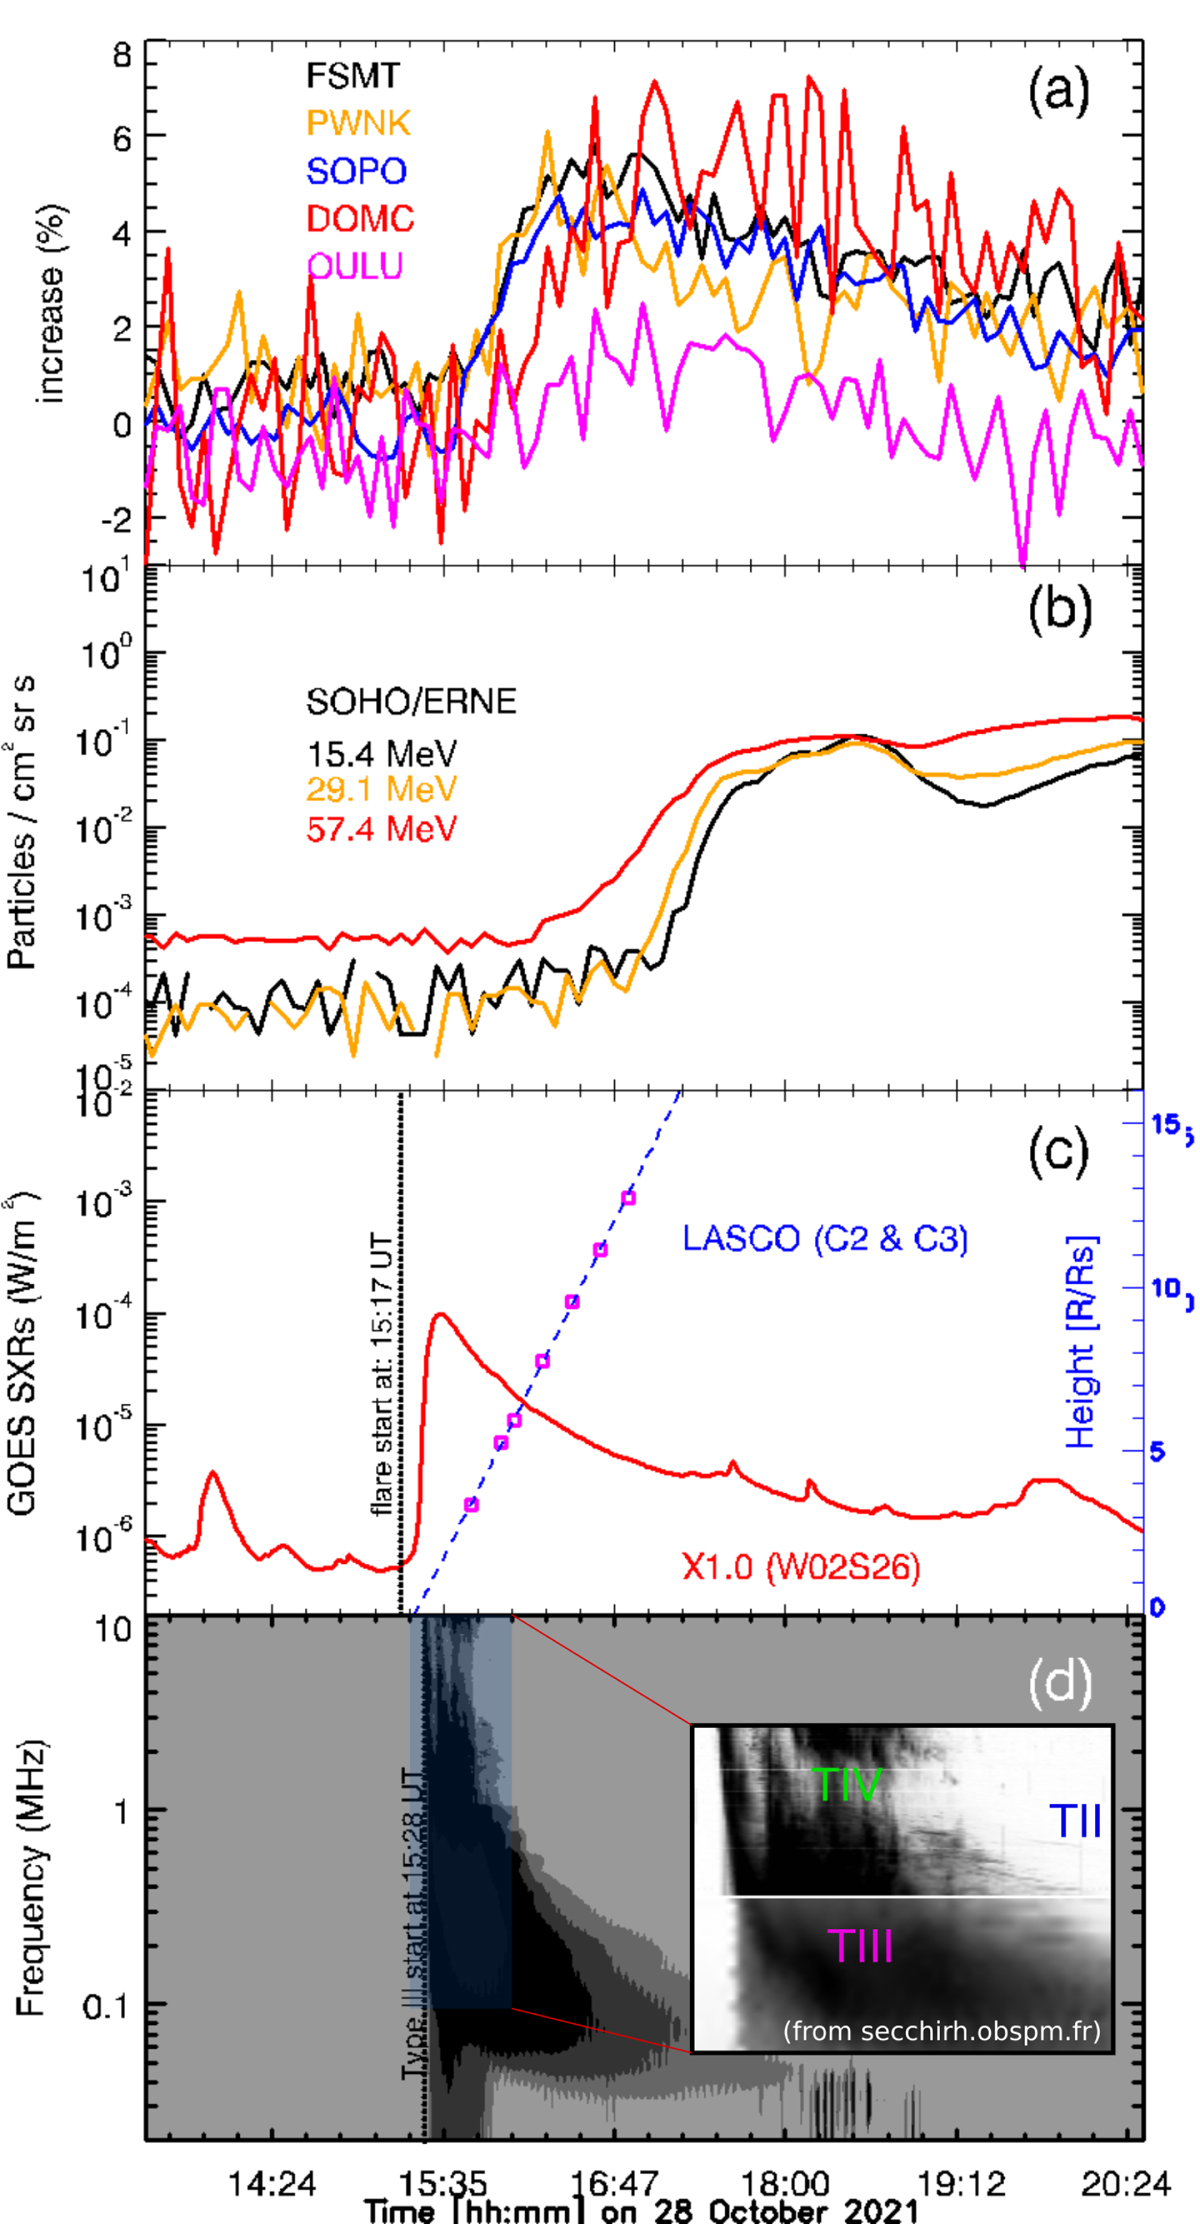
GLE73 on 28 October 2021. Panel a: increase (in percent) of several NMs based on 5-minute de-trended NM data. Panel b: SOHO/ERNE proton flux. Panel c: SXR flux observed by GOES, denoting an X1.0 solar flare (red curve; left axis). The vertical dashed black line corresponds to the start time of the flare. The height of the WL shock is shown with the magenta squares from measurements at the plane-of-sky near the CME leading edge. The dashed blue line is a linear fit to the height and extrapolated back to the surface of the Sun. Panel d: dynamic radio spectrum observed by Wind/WAVES. The dashed black line corresponds to the start time of the identified type III burst at ∼15:28 UT. The inset figure denotes the type II burst (in blue), the storm of type III bursts (in magenta), and the type IV burst (in green).
Current usage metrics show cumulative count of Article Views (full-text article views including HTML views, PDF and ePub downloads, according to the available data) and Abstracts Views on Vision4Press platform.
Data correspond to usage on the plateform after 2015. The current usage metrics is available 48-96 hours after online publication and is updated daily on week days.
Initial download of the metrics may take a while.


