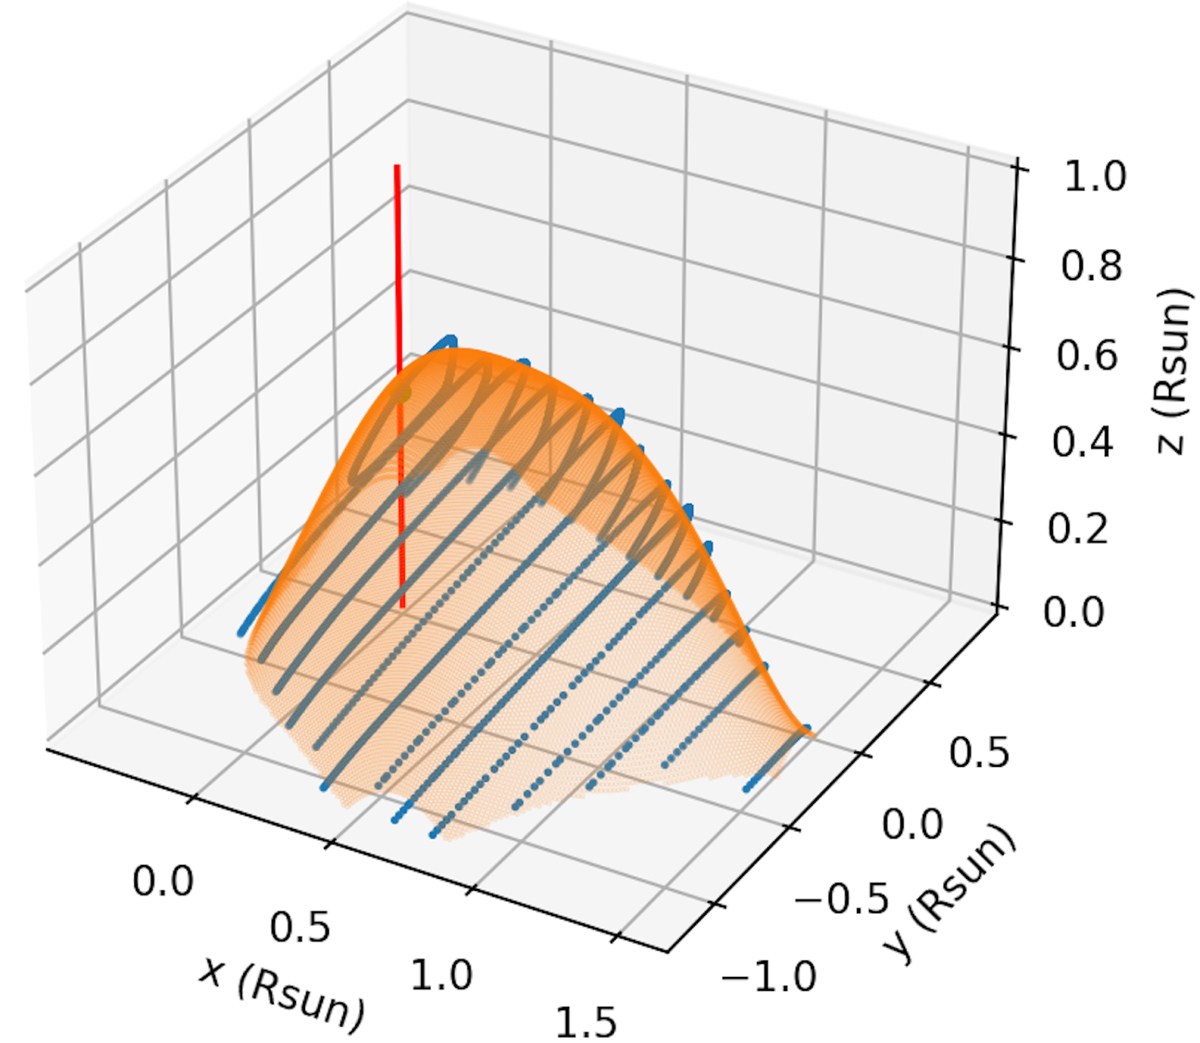
Fig. A.1.
Download original image
One example of the surface fitting of the CME bulge at 22:10 UT. Blue curves denote the cropped CME bulge reconstructed via the MF method. The orange surface is the result of the surface fitting. The red line represents the symmetrical axial direction of the bow shock. The intersection of the red line and the surface marked by a green dot is the CME nose.
Current usage metrics show cumulative count of Article Views (full-text article views including HTML views, PDF and ePub downloads, according to the available data) and Abstracts Views on Vision4Press platform.
Data correspond to usage on the plateform after 2015. The current usage metrics is available 48-96 hours after online publication and is updated daily on week days.
Initial download of the metrics may take a while.