Fig. 4.
Download original image
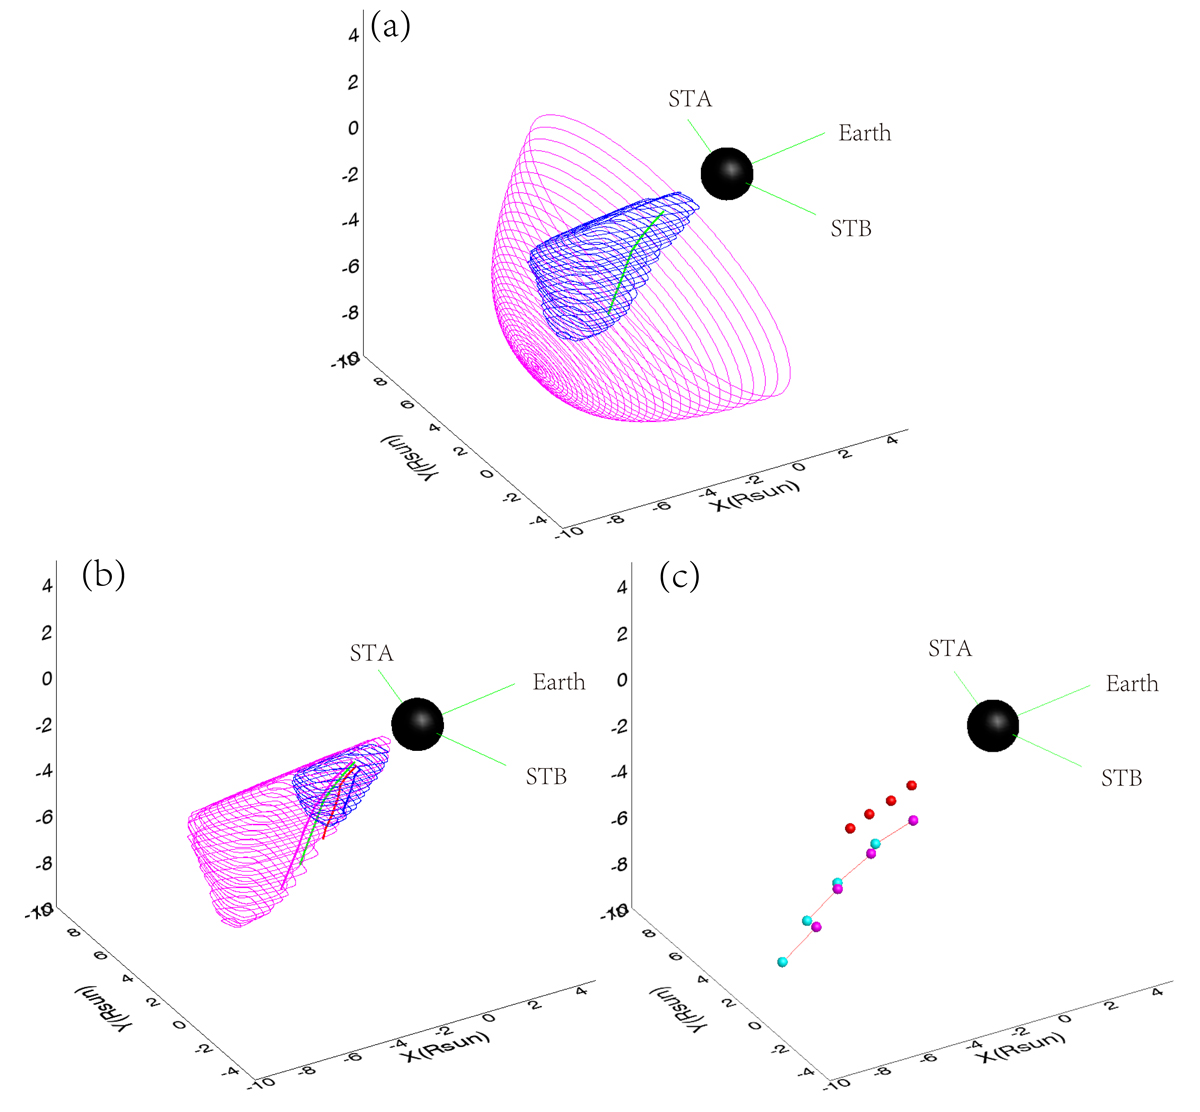
3D reconstructions of the CME, jet, and shock. (a): One example of a 3D jet (green), a CME cloud (blue), and a shock surface (magenta) at 21:55 UT. The three thin green axes show the orientations of STA, Earth, and STB, in a clockwise direction. (b): CME observed at 21:25 and 22:10 UT (the two clouds) and the jet observed at 21:25, 21:40, 21:55, and 22:10 UT (the four thick solid lines of different colors). (c): GCs of the CME clouds (red dots) and the CME nose at 21:25, 21:40, 21:55, and 22:10 UT (magenta dots). Cyan dots indicate the shock apex, and the orange line denotes the symmetrical bow axis pointing from the CME nose to the shock apex.
Current usage metrics show cumulative count of Article Views (full-text article views including HTML views, PDF and ePub downloads, according to the available data) and Abstracts Views on Vision4Press platform.
Data correspond to usage on the plateform after 2015. The current usage metrics is available 48-96 hours after online publication and is updated daily on week days.
Initial download of the metrics may take a while.