Fig. 3.
Download original image
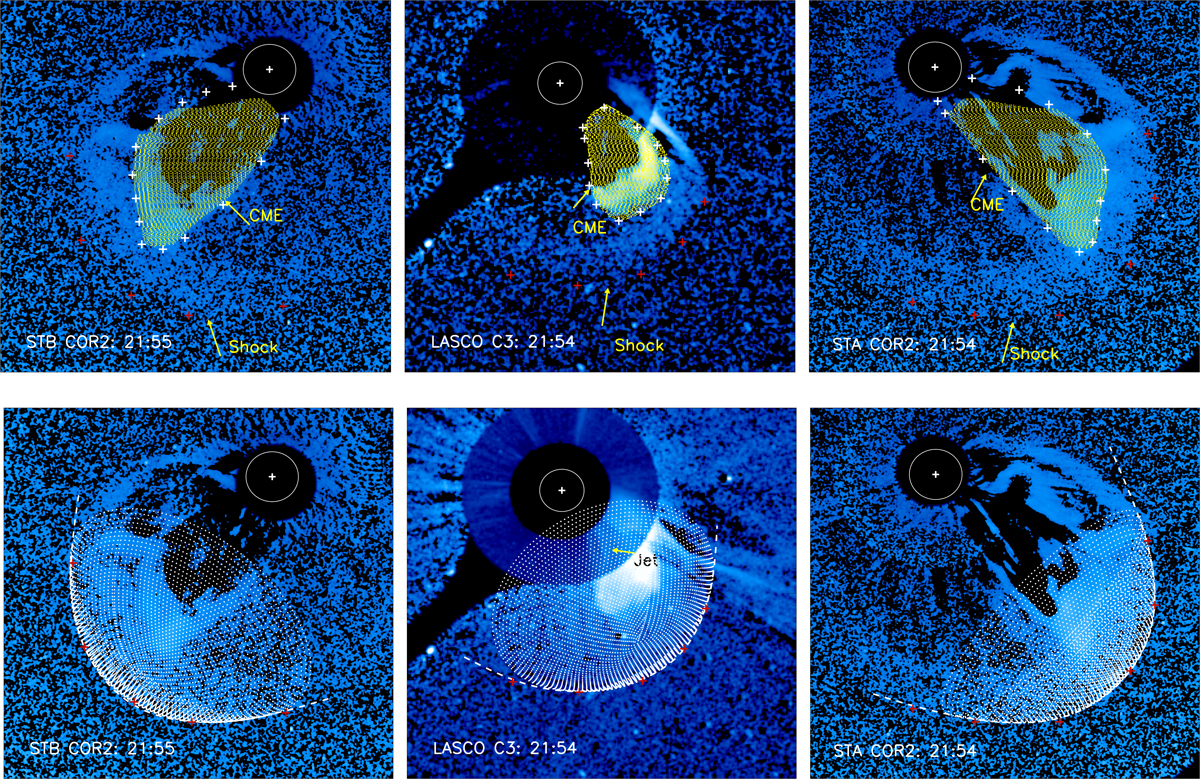
Projections of the 3D CME and shock in the three perspectives. Top: multipoint running-difference images at ∼21:54 UT. Yellow grids in the three perspectives mark projections of the 3D CME obtained from the MF method. The small white and red plus signs mark the possible peripheries of the CME and the shock, respectively. Bottom: projections of the 3D shock surface reconstructed by the bow-shock model on LASCO/C3 and STEREO/COR2 images. The bottom-middle panel is the base-difference image. The dashed white lines represent the position of the extended bow-shock surface in three perspectives. The red plus signs have the same positions as those in the top panels. Arrows mark the CME, shock, and jet.
Current usage metrics show cumulative count of Article Views (full-text article views including HTML views, PDF and ePub downloads, according to the available data) and Abstracts Views on Vision4Press platform.
Data correspond to usage on the plateform after 2015. The current usage metrics is available 48-96 hours after online publication and is updated daily on week days.
Initial download of the metrics may take a while.