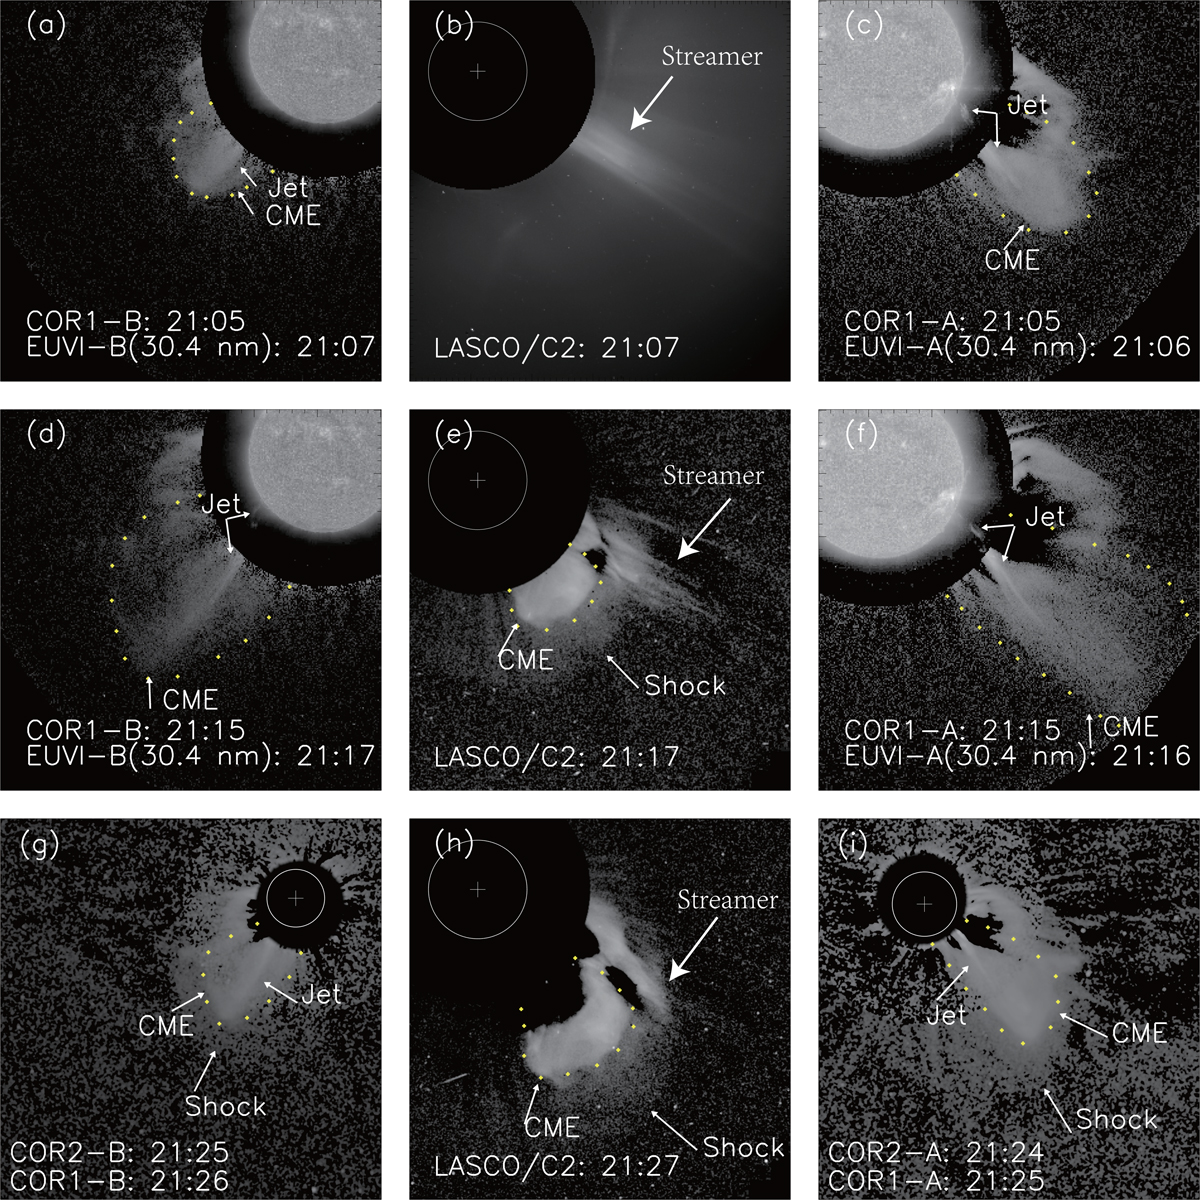
Fig. 2.
Download original image
Multipoint observations of the jet, the CME, and its driven shock from the SOHO LASCO/C2 and STEREO EUVI/COR1/COR2 instruments. The three images in each row represent three different perspectives at the proximate time. Each column represents the evolution of events from ∼21:05 UT to ∼21:25 UT in the same instrument. Panel b is an original image. Panels e and h are running-difference images presented to show the more apparent structure of the shock region. For COR data, the respective pre-CME images are subtracted. The white circle and the plus sign in each panel indicate the limb of the solar disk and solar center. The small yellow plus signs mark the possible CME peripheries. Arrows denote the jet, CME, and shock.
Current usage metrics show cumulative count of Article Views (full-text article views including HTML views, PDF and ePub downloads, according to the available data) and Abstracts Views on Vision4Press platform.
Data correspond to usage on the plateform after 2015. The current usage metrics is available 48-96 hours after online publication and is updated daily on week days.
Initial download of the metrics may take a while.