Fig. 5
Download original image
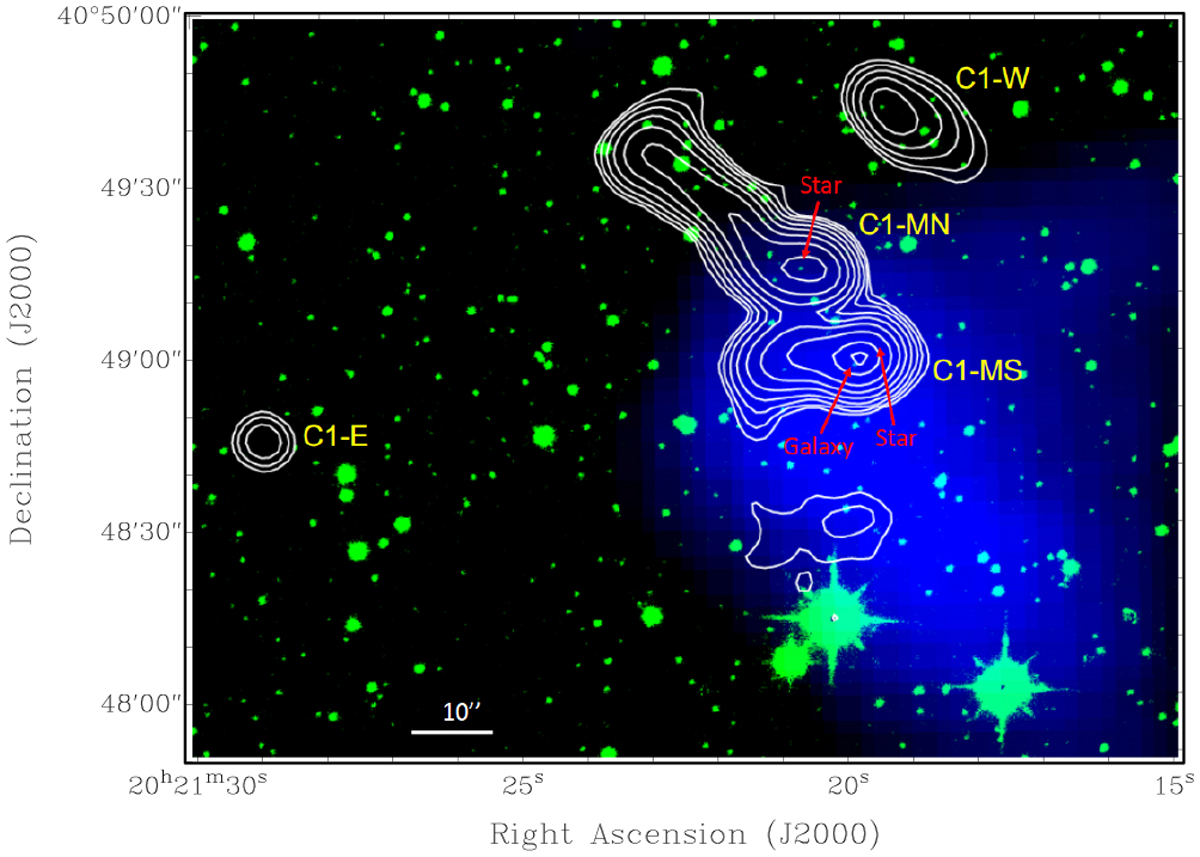
Archive Chandra image of the clump C1 smoothed with a 12-arcsec Gaussian function (blue) and the K-band image from UKIDSS (green). The overlaid white contours represent the 610 MHz radio emission from GMRT. Contour levels are 6, 12, 24, 48, 96, 192, 384, and 768 times the rms noise (0.13 mJy beam−1). The northern part of the source C1-MN, and the sources C1-W and C1-E, fell just off the Chandra CCD chips.
Current usage metrics show cumulative count of Article Views (full-text article views including HTML views, PDF and ePub downloads, according to the available data) and Abstracts Views on Vision4Press platform.
Data correspond to usage on the plateform after 2015. The current usage metrics is available 48-96 hours after online publication and is updated daily on week days.
Initial download of the metrics may take a while.