Fig. 4
Download original image
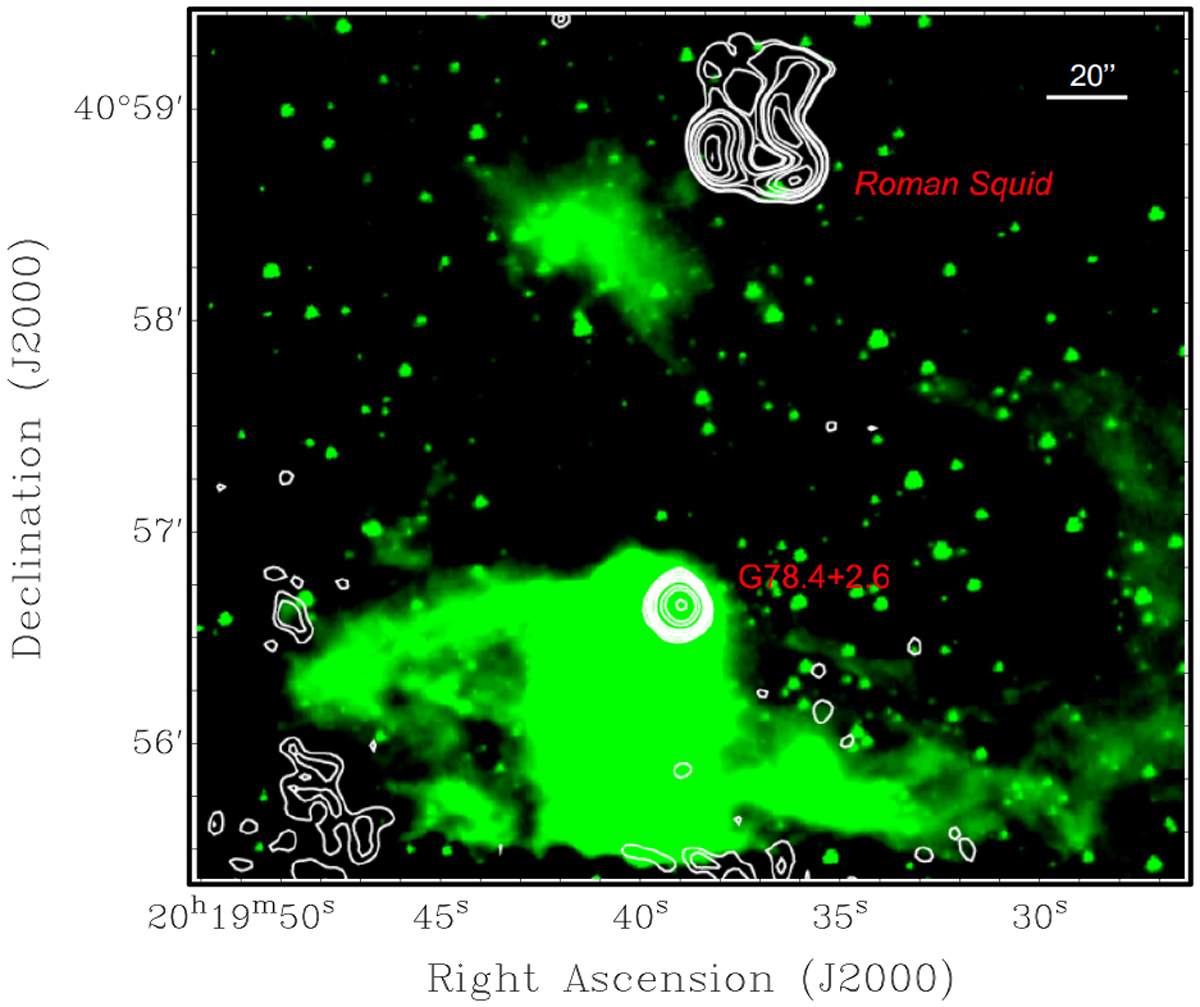
Spitzer 3.6 μm band emission image (green colour) of the region around the ultracompact H II region G78.4+2.6. The GMRT 610 MHz radio emission of this area is shown in white contours, which are 3, 4, 8, 10, 15, 20, 30, 35, 40, 80, 120, and 240 times the rms noise (0.13 mJy beam−1). The source Roman Squid is visible to the north.
Current usage metrics show cumulative count of Article Views (full-text article views including HTML views, PDF and ePub downloads, according to the available data) and Abstracts Views on Vision4Press platform.
Data correspond to usage on the plateform after 2015. The current usage metrics is available 48-96 hours after online publication and is updated daily on week days.
Initial download of the metrics may take a while.