Fig. 3
Download original image
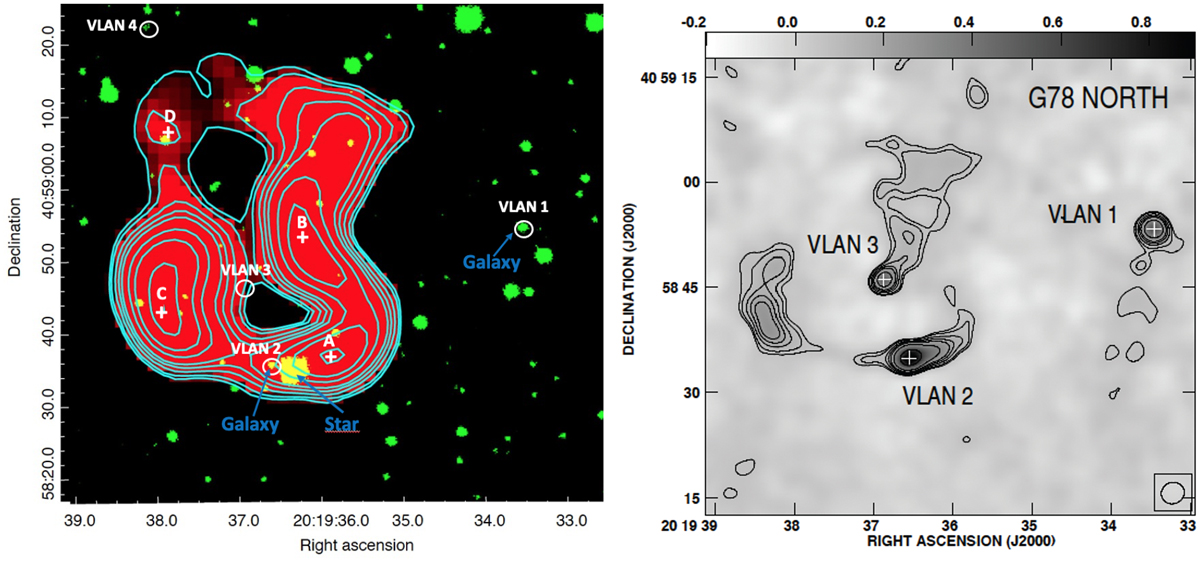
Radio images of the Roman Squid source. Left: GMRT 610 MHz radio image of the Roman Squid source in red. The peak position of each of the four components A, B, C, and D are marked with a white cross. For clarity, we also show the contour levels, 3, 4, 6, 8, 10, 15, 20, 30, 35, and 40 times the rms noise (130 μJy beam−1). In green we show an infrared K-band image of the region from the UKIDSS catalogue. We note that the green within the red region appears as yellow. The white circles indicate the position of the VLAN sources. Right: VLA 8.4 GHz radio image of the same field (Neria et al. 2010). Contour levels are 3, 4, 6, 8, 10, 15, 30, and 50 times the average rms noise of the image (21.8 μJy beam−1).
Current usage metrics show cumulative count of Article Views (full-text article views including HTML views, PDF and ePub downloads, according to the available data) and Abstracts Views on Vision4Press platform.
Data correspond to usage on the plateform after 2015. The current usage metrics is available 48-96 hours after online publication and is updated daily on week days.
Initial download of the metrics may take a while.