Fig. 2
Download original image
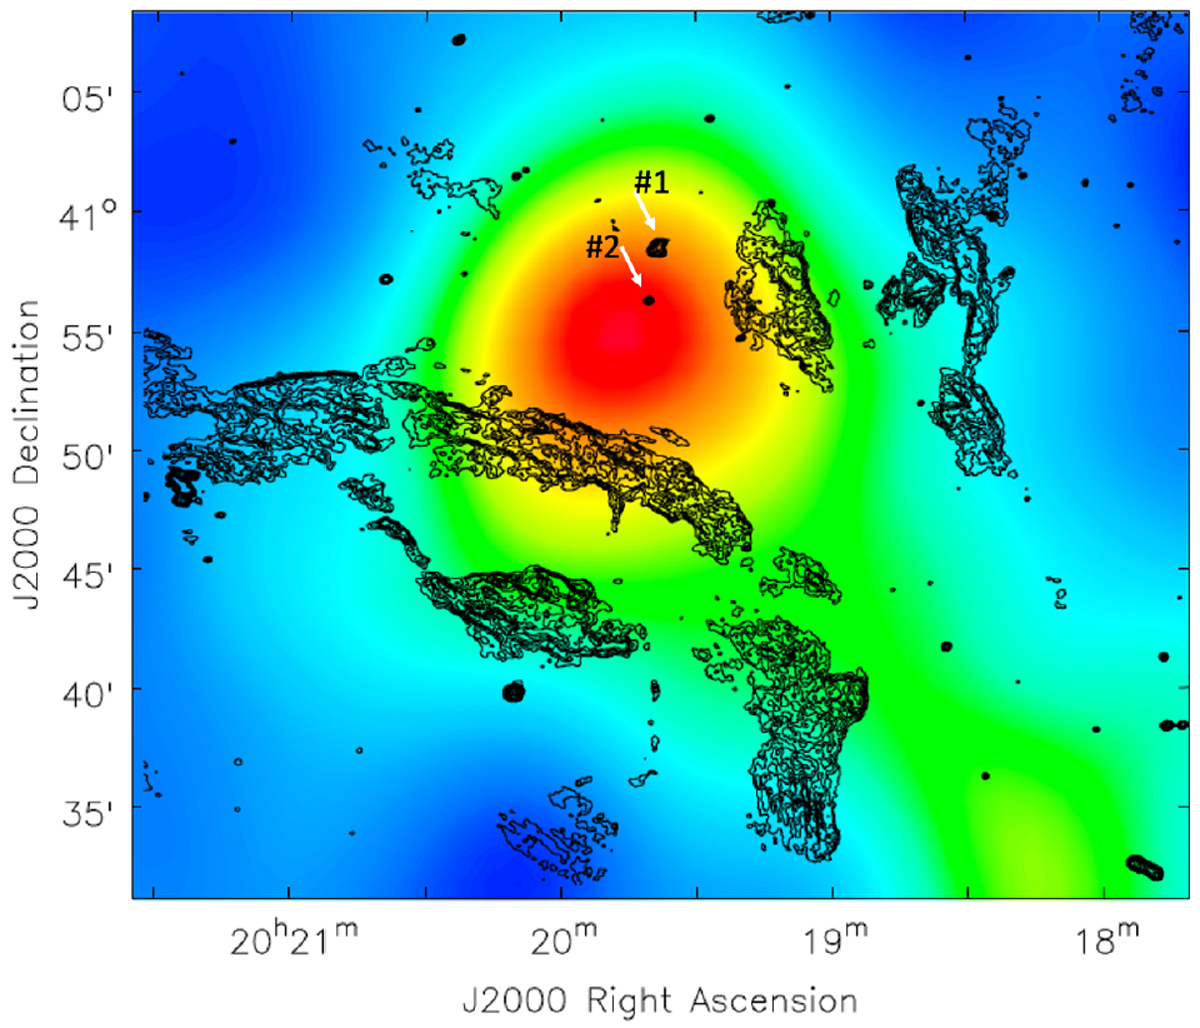
Sky map in units of relative flux (excess over background) of the γ Cygni SNR region as observed by MAGIC at energies E > 250 GeV (see MAGIC Collaboration 2020, for details). The overlaid black contours represent the 325 MHz emission measured by GMRT. The sources Roman Squid (#1) and G78.4+2.6 (#2) are marked with white arrows (extended sources R1 and R2 at 325 MHz – see Fig. 1 – lie to their west and south, respectively).
Current usage metrics show cumulative count of Article Views (full-text article views including HTML views, PDF and ePub downloads, according to the available data) and Abstracts Views on Vision4Press platform.
Data correspond to usage on the plateform after 2015. The current usage metrics is available 48-96 hours after online publication and is updated daily on week days.
Initial download of the metrics may take a while.