Fig. 1
Download original image
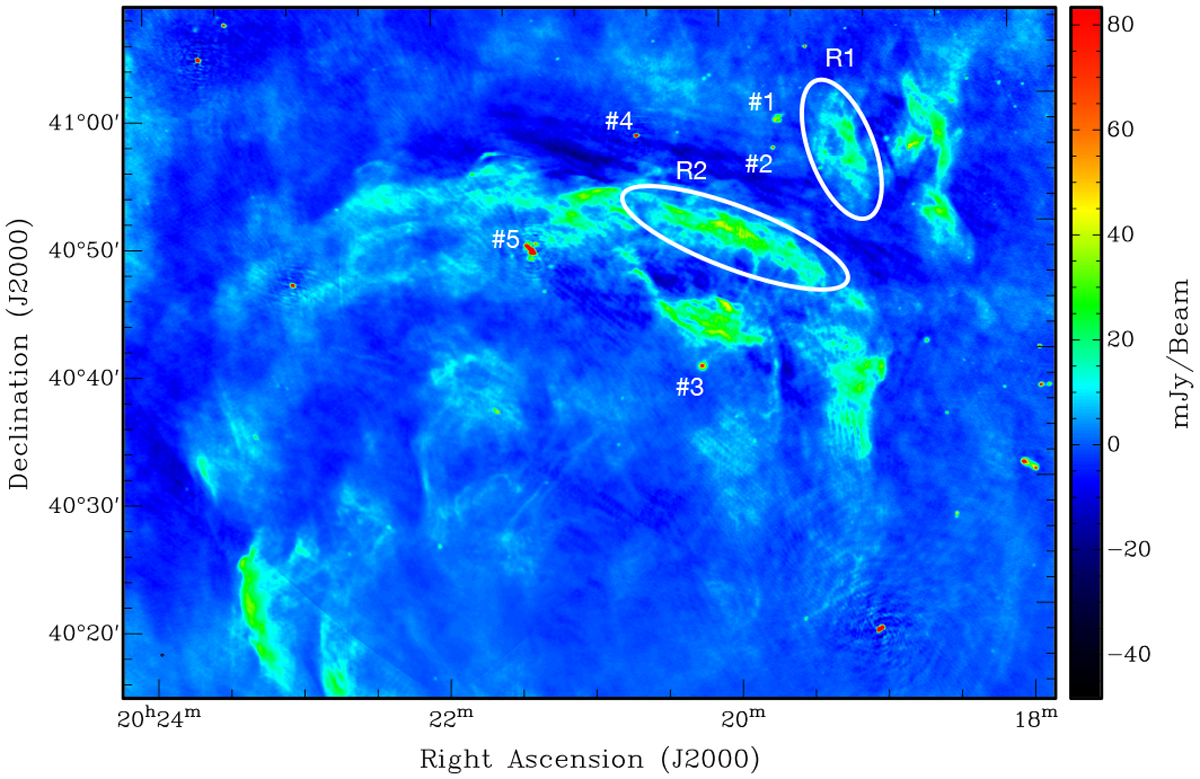
325 MHz radio image of the Cygni SNR (G78.2+2.1). The numeric labels, and R1 and R2, identify the sources and the diffuse enhanced emission regions, respectively, that are discussed in detail here (see Table 1). The colour scale interval shown is (–48, +83) mJy beam–1 to outline weaker features. The synthesised beam (11.95″ × 9.61″, -76.6°) is plotted at the bottom left corner. The rms, where the emission is lowest, is ≃0.5 mJy beam−1.
Current usage metrics show cumulative count of Article Views (full-text article views including HTML views, PDF and ePub downloads, according to the available data) and Abstracts Views on Vision4Press platform.
Data correspond to usage on the plateform after 2015. The current usage metrics is available 48-96 hours after online publication and is updated daily on week days.
Initial download of the metrics may take a while.