Fig. 8.
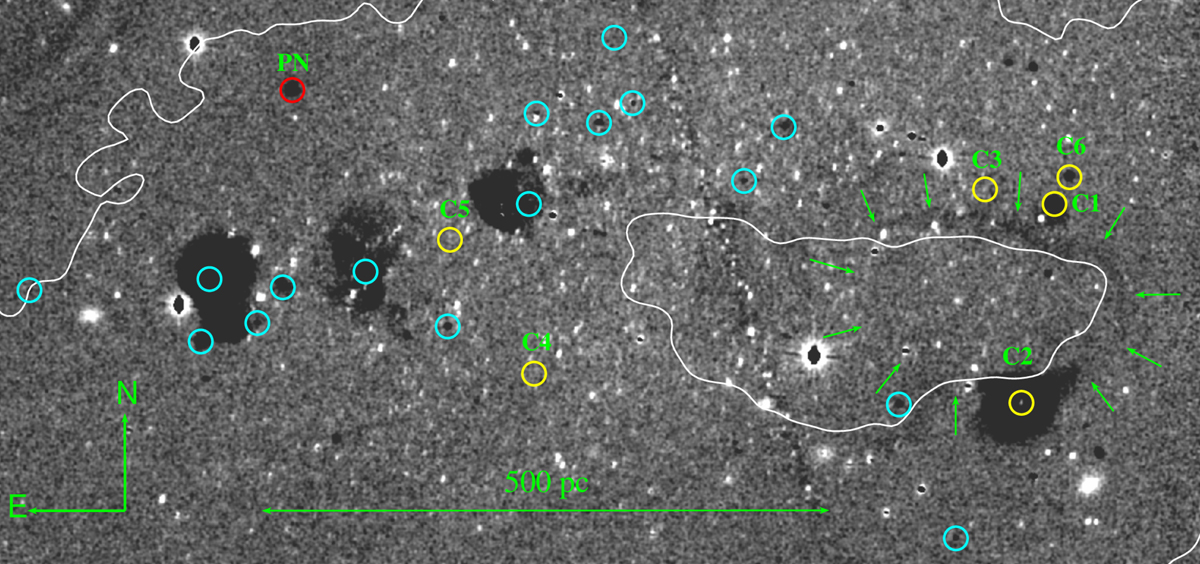
Download original image
Subaru/Suprime-Cam Hα map of the Leo A galaxy constructed by subtracting a frame in the R passband from the one in the Hα passband. Darker areas correspond to enhanced Hα emission regions (e.g. H II zones and emission stars). Cyan open circles mark 16 BHeB Hα emission stars. Yellow open circles mark star clusters (C1–C6). The red open circle marks planetary nebula (PN). Green arrows indicate an approximate size of the Hα emission ring. White contours correspond to the H I column density of 4 × 10²⁰ atoms cm−2. Inside the closed white contour, the H I column density is lower than outside of it. North is up, and east is to the left.
Current usage metrics show cumulative count of Article Views (full-text article views including HTML views, PDF and ePub downloads, according to the available data) and Abstracts Views on Vision4Press platform.
Data correspond to usage on the plateform after 2015. The current usage metrics is available 48-96 hours after online publication and is updated daily on week days.
Initial download of the metrics may take a while.