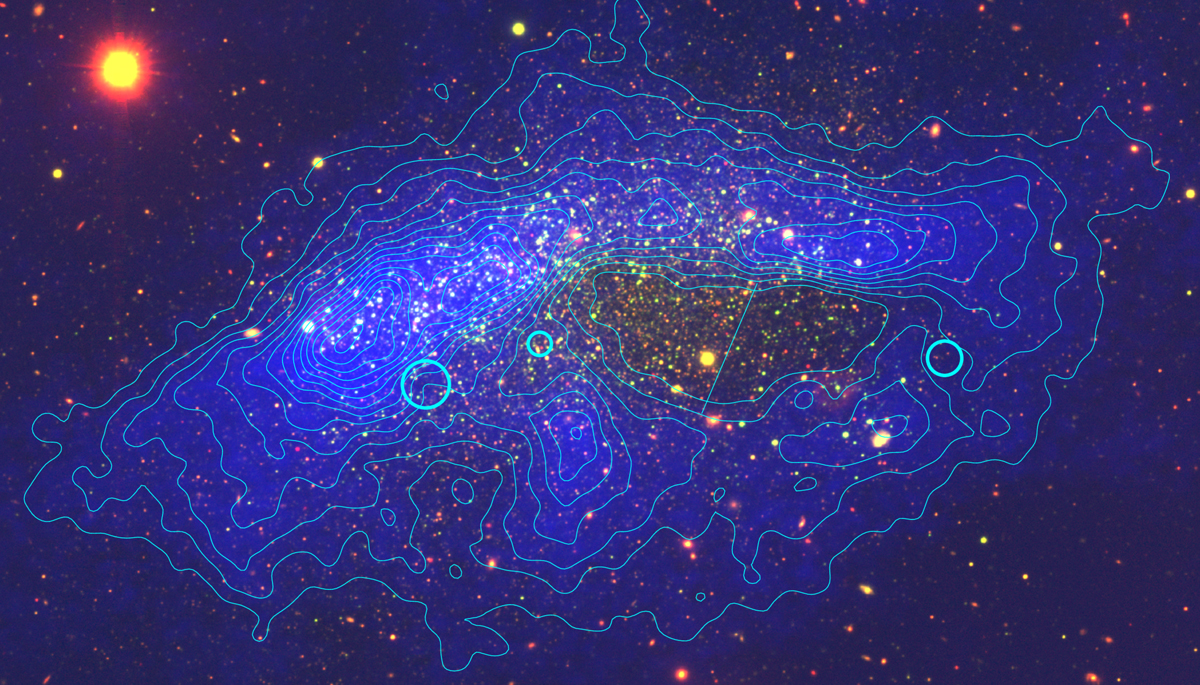
Fig. 7.
Download original image
Composite image of the Leo A galaxy: Subaru/Suprime-Cam Hα (red) and B (green) passbands and the H I column density map (blue) with cyan contours, indicating the range of column density levels (atoms cm−2) from 4 × 10²⁰ to 7 × 10²¹ with a constant step of 1020 (Hunter et al. 2012). The straight cyan line divides the largest H I hole into two regions with apparently different stellar populations. Positions and sizes of three small holes in the H I envelope, identified by Pokhrel et al. (2020), are indicated with cyan circles.
Current usage metrics show cumulative count of Article Views (full-text article views including HTML views, PDF and ePub downloads, according to the available data) and Abstracts Views on Vision4Press platform.
Data correspond to usage on the plateform after 2015. The current usage metrics is available 48-96 hours after online publication and is updated daily on week days.
Initial download of the metrics may take a while.