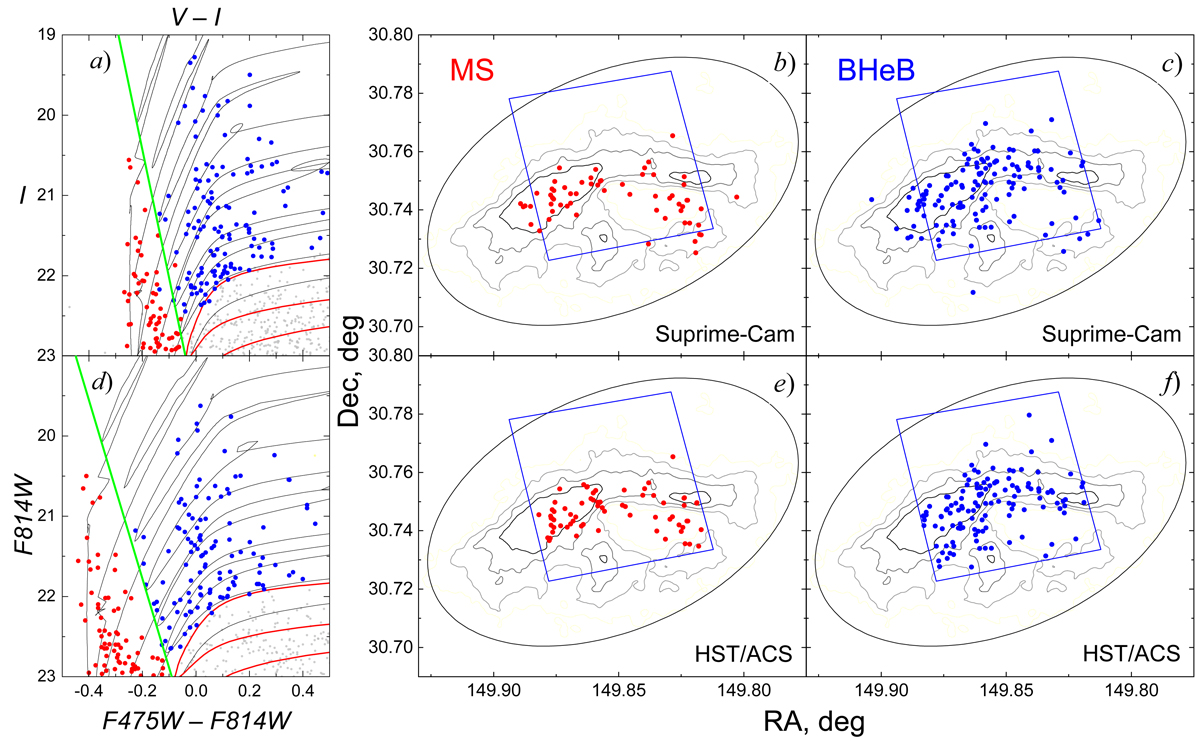
Fig. 1.
Download original image
MS (red) and BHeB (blue) stars of the Leo A galaxy. Panel a: I versus V − I diagram of Suprime-Cam data with isochrones of 15, 30, 55, 100, 160, and 220 Myr ages plotted as black lines (Z = 0.0001); the red line marks the isochrone of 320 Myr age (Z = 0.0001), which was used as a selection limit for the BHeB stars. The diagonal green line, I = 23.64 + 16.00 ⋅ (V − I), marks the assumed separation limit between the MS and BHeB stars. Panels b and c: spatial distributions of the MS and BHeB stars selected based on Suprime-Cam photometry data, respectively. Panel d: F814W versus F475W − F814W diagram of ACS data. The ages and metallicity of isochrones are the same as in panel a. The diagonal green line separating MS and BHeB stars is given by F814W = 24.00 + 11.11 ⋅ (F475W − F814W). Panels e and f: spatial distributions of the MS and BHeB stars selected based on ACS photometry data, respectively. An ellipse of a = 4′ (the black line) and the HST/ACS field (the blue line) are shown in each spatial distribution diagram. H I column density contours (Hunter et al. 2012) of the following density levels (atoms cm−2): 4 × 10²⁰, 8 × 10²⁰, 1.3 × 10²¹, and 2 × 10²¹ are plotted in each spatial distribution diagram (from grey to black; darker contours correspond to higher column density).
Current usage metrics show cumulative count of Article Views (full-text article views including HTML views, PDF and ePub downloads, according to the available data) and Abstracts Views on Vision4Press platform.
Data correspond to usage on the plateform after 2015. The current usage metrics is available 48-96 hours after online publication and is updated daily on week days.
Initial download of the metrics may take a while.