Fig. 5
Download original image
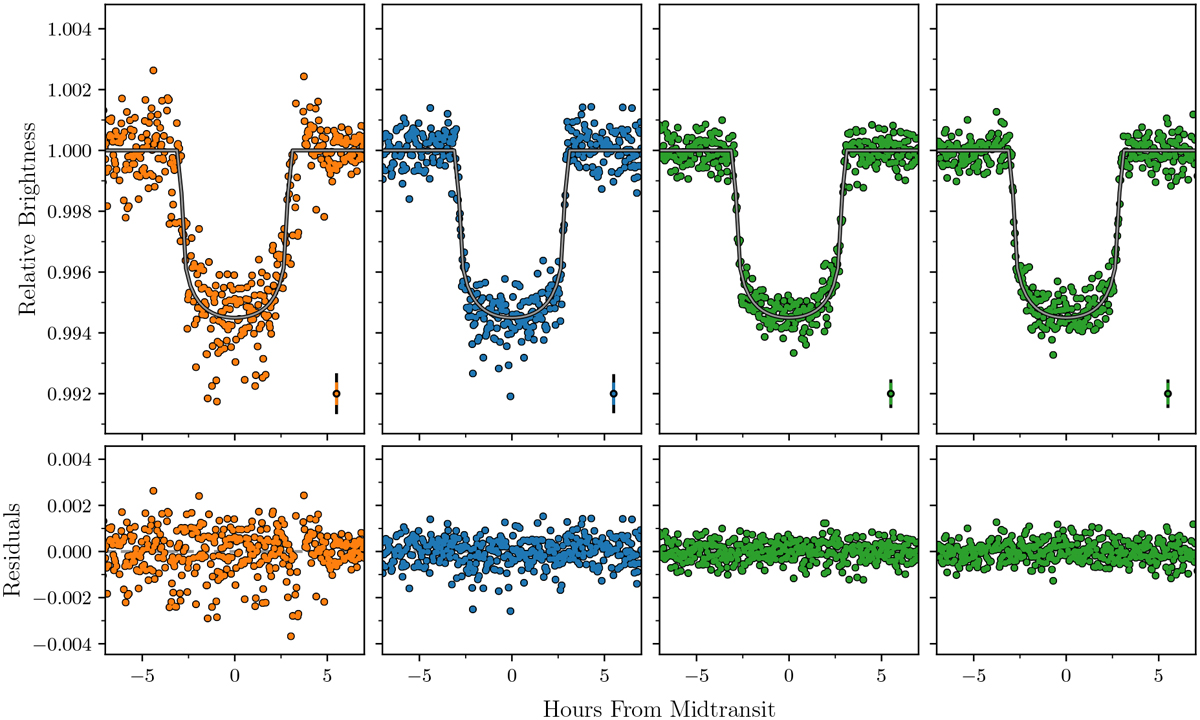
Four transits of HD 332231 b. Top: transit data points from the TESS light curve after correction using the GP model seen in Fig. 1. The grey line is the best-fitting light curve model. Bottom: residuals from subtracting the best-fitting model from the data. In each top panel, we show an error bar that is representative of the error from this particular selection of data. We added the photometric jitter in quadrature (shown in black) to the nominal error (coloured).
Current usage metrics show cumulative count of Article Views (full-text article views including HTML views, PDF and ePub downloads, according to the available data) and Abstracts Views on Vision4Press platform.
Data correspond to usage on the plateform after 2015. The current usage metrics is available 48-96 hours after online publication and is updated daily on week days.
Initial download of the metrics may take a while.