Fig. 3
Download original image
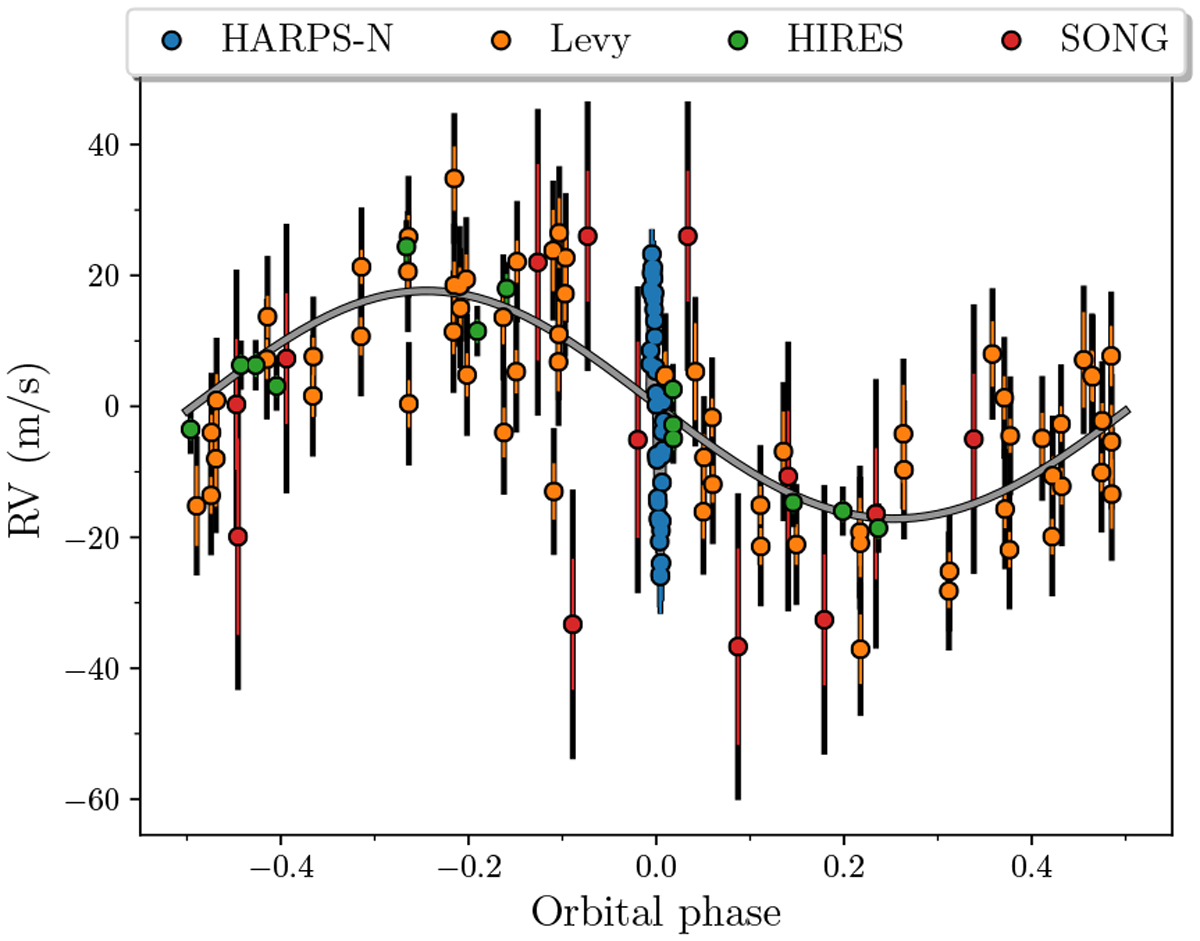
Radial velocity curve for HD 332231 b. Radial velocities from HARPS-N, Levy, HIRES, and SONG shown with blue, orange, green, and red error bars, respectively. The grey line is the best-fitting model of the orbit modulated by the RM effect, which is obscured by the HARPS-N data. The coloured error bars are the nominal errors, and the black error bar is the nominal error with the jitter term added in quadrature.
Current usage metrics show cumulative count of Article Views (full-text article views including HTML views, PDF and ePub downloads, according to the available data) and Abstracts Views on Vision4Press platform.
Data correspond to usage on the plateform after 2015. The current usage metrics is available 48-96 hours after online publication and is updated daily on week days.
Initial download of the metrics may take a while.