Fig. 8
Download original image
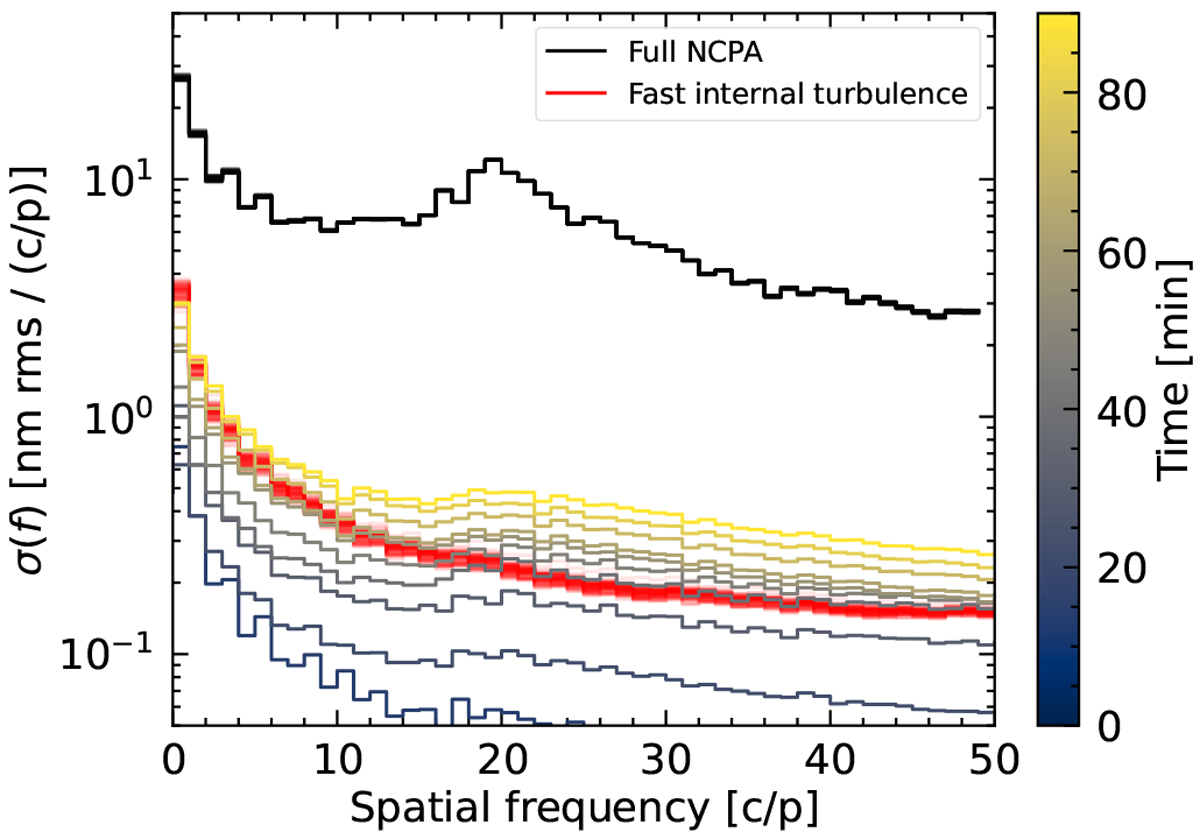
Relative contributions of the full NCPA (black), the estimated fast internal turbulence (red), and the slow-varying NCPA at different times (increasing with time, from blue to yellow), measured on the 2017-03-25 b sequence. The curves correspond to averages, in consecutive bins of 3 min for the full NCPA and the fast internal turbulence and 10 min for the slow-varying NCPA.
Current usage metrics show cumulative count of Article Views (full-text article views including HTML views, PDF and ePub downloads, according to the available data) and Abstracts Views on Vision4Press platform.
Data correspond to usage on the plateform after 2015. The current usage metrics is available 48-96 hours after online publication and is updated daily on week days.
Initial download of the metrics may take a while.