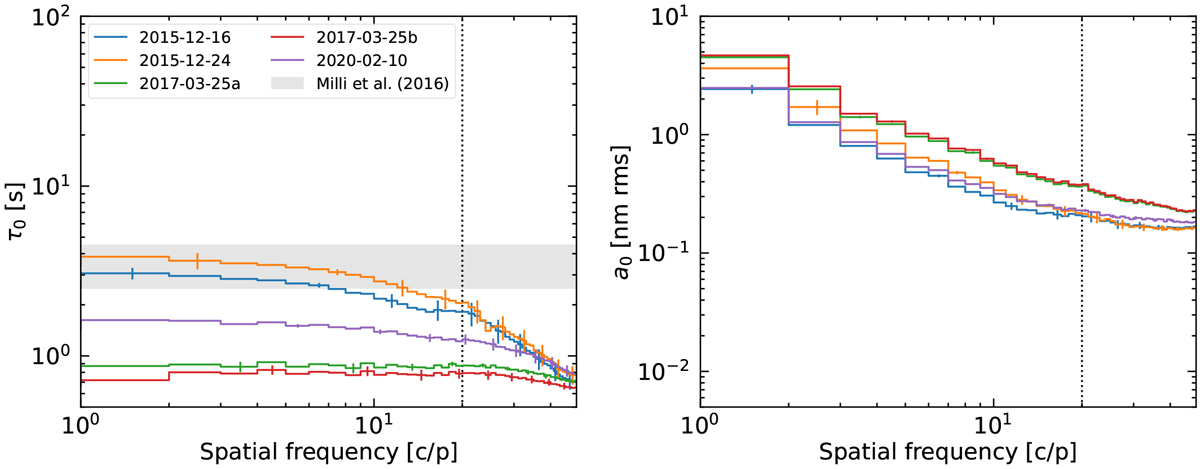
Fig. 4
Download original image
Fit of the parameters modeling the fast exponential decorrelation of the NCPA as a function of spatial frequency in the original sequences. The quantities τ0 and a0 represent the characteristic time and amplitude of the decorrelation. The dotted line at 20 c/p shows the cutoff of the SPHERE ExAO system. The range of values estimated by Milli et al. (2016) from focal-plane images are overplotted in gray for comparison.
Current usage metrics show cumulative count of Article Views (full-text article views including HTML views, PDF and ePub downloads, according to the available data) and Abstracts Views on Vision4Press platform.
Data correspond to usage on the plateform after 2015. The current usage metrics is available 48-96 hours after online publication and is updated daily on week days.
Initial download of the metrics may take a while.