Fig. 3
Download original image
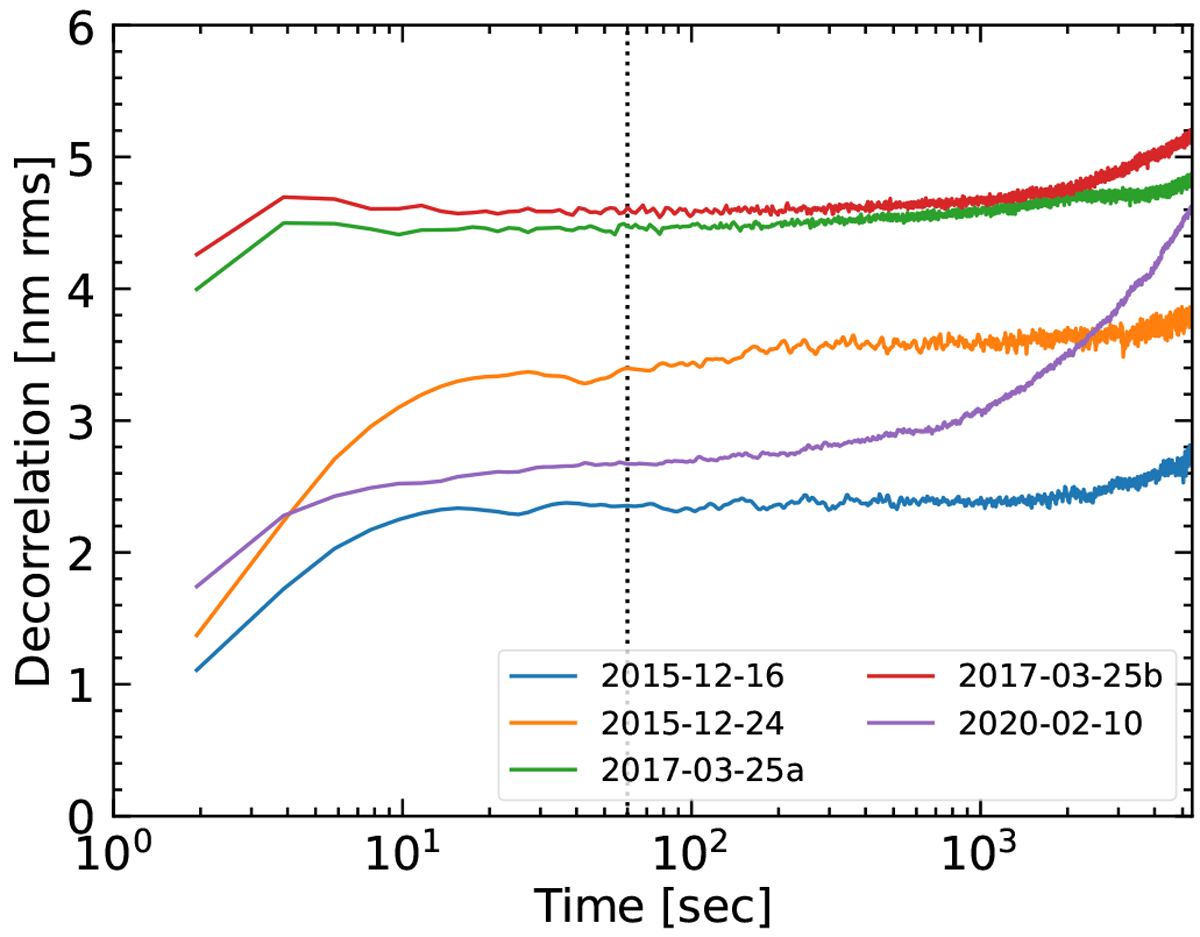
Average decorrelation of OPD maps between 1 and 2 c/p over time differences up to 1.5 h in our sequences. The curves are computed as the average along the diagonals of Ɗf (i.e., at fixed time differences, see Sect. 2.2). Two distinct regimes are visible: a fast decorrelation on timescales below a few seconds and a much slower, quasi-linear decorrelation on timescales of minutes to hours. The dotted line at 60 s corresponds to the limit for the fitting of the parameters of the decorrelation (Eq. (2)).
Current usage metrics show cumulative count of Article Views (full-text article views including HTML views, PDF and ePub downloads, according to the available data) and Abstracts Views on Vision4Press platform.
Data correspond to usage on the plateform after 2015. The current usage metrics is available 48-96 hours after online publication and is updated daily on week days.
Initial download of the metrics may take a while.