Fig. 2
Download original image
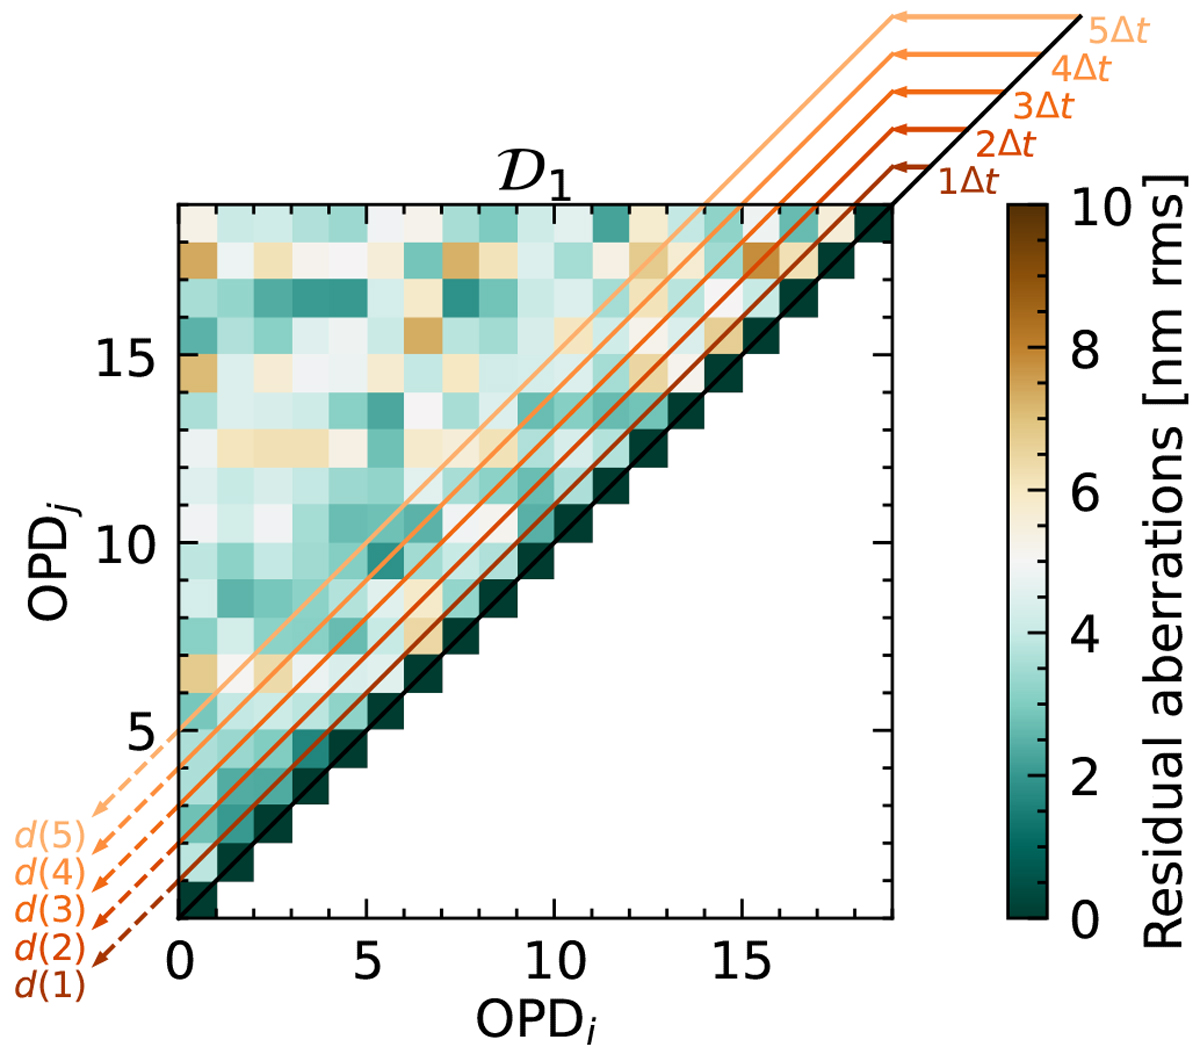
Illustration of a small 20 × 20 decorrelation matrix Ɗ1 for 20 consecutive OPD maps extracted from the 2017-02-23 b sequence. The value of each point (i, j) of the matrix corresponds to the amount of aberrations between 1 and 2c/p in δOPDij = OPDi - OPDj (see Sect. 2.2.1 for details). Each diagonal (1Δt, 2Δt,…) corresponds to a fixed time difference between OPDs. The average decorrelation d(t) of the OPD maps is computed by averaging values along each diagonal.
Current usage metrics show cumulative count of Article Views (full-text article views including HTML views, PDF and ePub downloads, according to the available data) and Abstracts Views on Vision4Press platform.
Data correspond to usage on the plateform after 2015. The current usage metrics is available 48-96 hours after online publication and is updated daily on week days.
Initial download of the metrics may take a while.