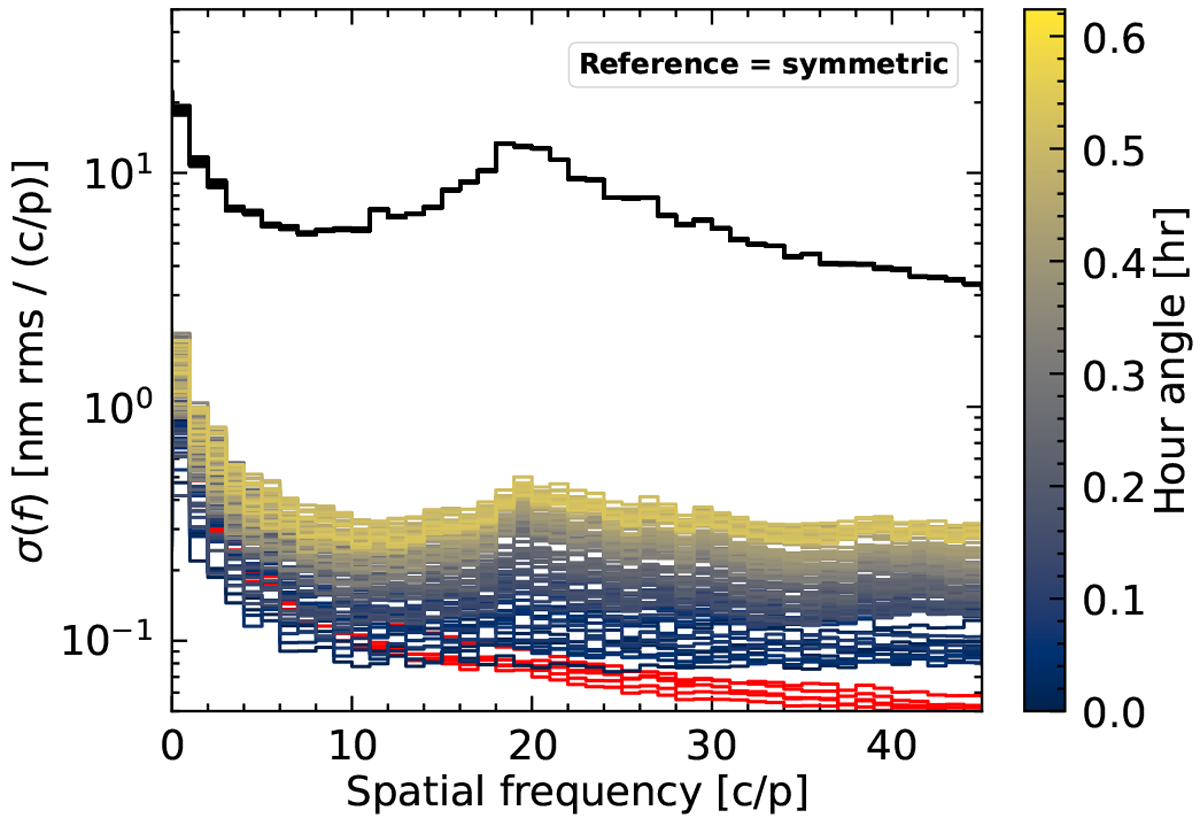
Fig. 15
Download original image
Residual aberrations in differential OPD maps obtained for the simulated realistic observation of a target at declination δ = −37° and at hour angles from −0.62 h to +0.53 h. In this sequence the UT3 telescope was tracking inside the dome, and the derotator and ADCs were tracking as in a real observation. The OPD maps are subtracted by quasi-symmetric pairs around meridian passage, that is for almost identical orientations of the derotator. The red curves show the contribution for the estimated fast internal turbulence over 20 s timescales for the temporal sequences presented in Sect. 2.2.
Current usage metrics show cumulative count of Article Views (full-text article views including HTML views, PDF and ePub downloads, according to the available data) and Abstracts Views on Vision4Press platform.
Data correspond to usage on the plateform after 2015. The current usage metrics is available 48-96 hours after online publication and is updated daily on week days.
Initial download of the metrics may take a while.