Fig. 13
Download original image
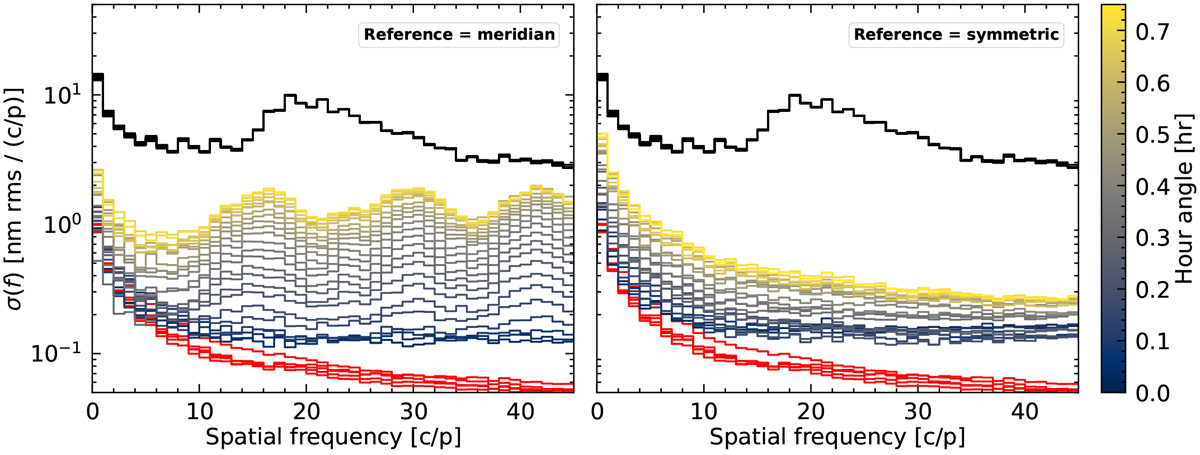
Residual aberrations in differential OPD maps obtained for different orientations of the derotator, simulating the observation of a target at declination δ = −15° and at hour angles from −0.75 h to +0.75 h. The black curves corresponds to σ(ƒ) for OPD maps before any subtraction. In the left plot, the OPD map obtained at meridian passage is used as reference and subtracted from all subsequent maps. The σ(ƒ) for the residuals when subtracting the reference map from the preceding maps is not shown because it is almost identical. In the right plot, the OPD maps are subtracted in pairs (two at a time) symmetrically around meridian passage (i.e., for almost identical orientations of the derotator). The red curves show the contribution for the estimated fast internal turbulence over 20 s timescales for the temporal sequences presented in Sect. 2.2.
Current usage metrics show cumulative count of Article Views (full-text article views including HTML views, PDF and ePub downloads, according to the available data) and Abstracts Views on Vision4Press platform.
Data correspond to usage on the plateform after 2015. The current usage metrics is available 48-96 hours after online publication and is updated daily on week days.
Initial download of the metrics may take a while.