Fig. 1
Download original image
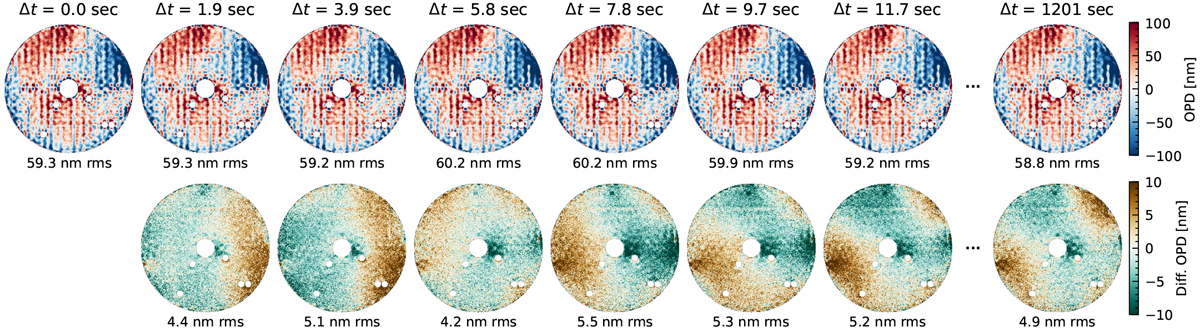
Temporal gallery of eight OPD maps acquired on 2015 December 16. The first seven maps are consecutive, while the last one was acquired after approximately 20 min. The top row shows the individual OPD maps and the bottom row shows the differential maps obtained by subtracting the first map to the subsequent ones. The dead actuators of the deformable mirror and the region corresponding to the central obscuration have been masked. The standard deviation is reported underneath each map.
Current usage metrics show cumulative count of Article Views (full-text article views including HTML views, PDF and ePub downloads, according to the available data) and Abstracts Views on Vision4Press platform.
Data correspond to usage on the plateform after 2015. The current usage metrics is available 48-96 hours after online publication and is updated daily on week days.
Initial download of the metrics may take a while.