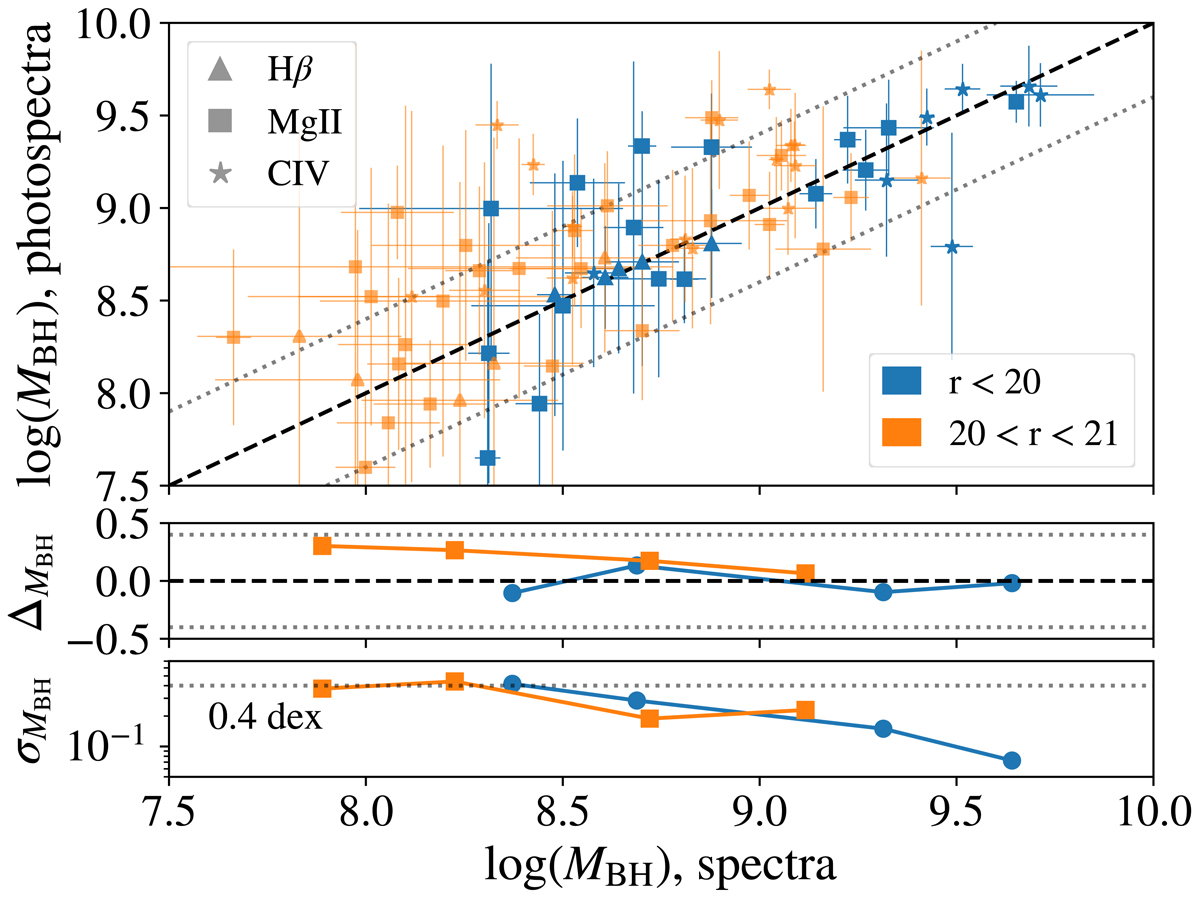
Fig. 7.
Download original image
SMBH mass measurements from SDSS spectra and miniJPAS photospectra. The middle and bottom sub-panels display the mean and standard deviation of the logarithmic difference between spectroscopic and photometric measurements, respectively, the dashed line indicates a 1:1 relation between these measurements, and dotted lines are displaced 0.4 dex from such a relation. As we can see, there is a remarkable agreement between SES and SEP masses, with most measurements less than 1σ away from the 1:1 relation.
Current usage metrics show cumulative count of Article Views (full-text article views including HTML views, PDF and ePub downloads, according to the available data) and Abstracts Views on Vision4Press platform.
Data correspond to usage on the plateform after 2015. The current usage metrics is available 48-96 hours after online publication and is updated daily on week days.
Initial download of the metrics may take a while.