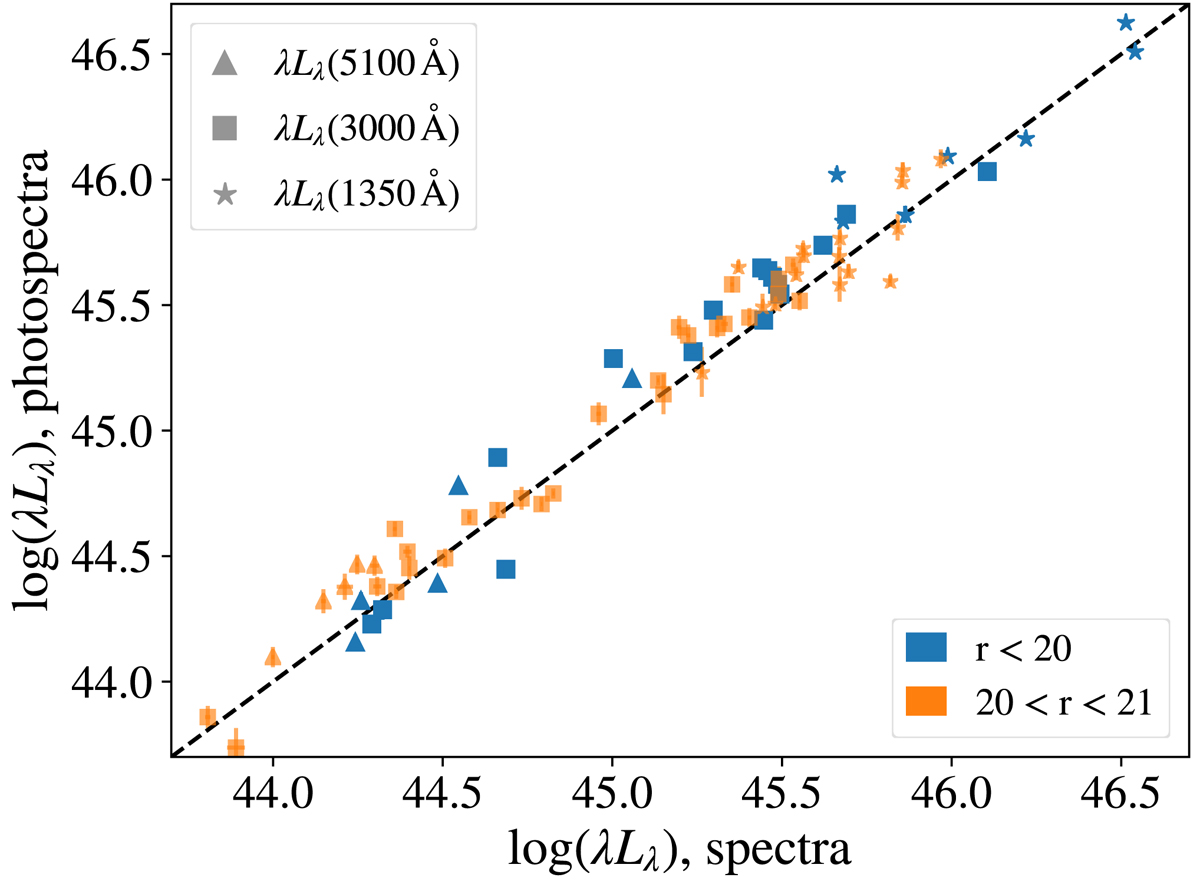
Fig. 5.
Download original image
Continuum luminosity measurements from SDSS spectra and miniJPAS photospectra. Triangles, squares, and stars indicate the continuum luminosity at λ = 5100, 3000, and 1350 Å, respectively. Blue and orange symbols display the results for sources with r < 20 and 20 < r < 21, error bars denote 1σ-equivalent uncertainties, and the dashed line indicates a 1:1 relation between SES and SEP measurements.
Current usage metrics show cumulative count of Article Views (full-text article views including HTML views, PDF and ePub downloads, according to the available data) and Abstracts Views on Vision4Press platform.
Data correspond to usage on the plateform after 2015. The current usage metrics is available 48-96 hours after online publication and is updated daily on week days.
Initial download of the metrics may take a while.