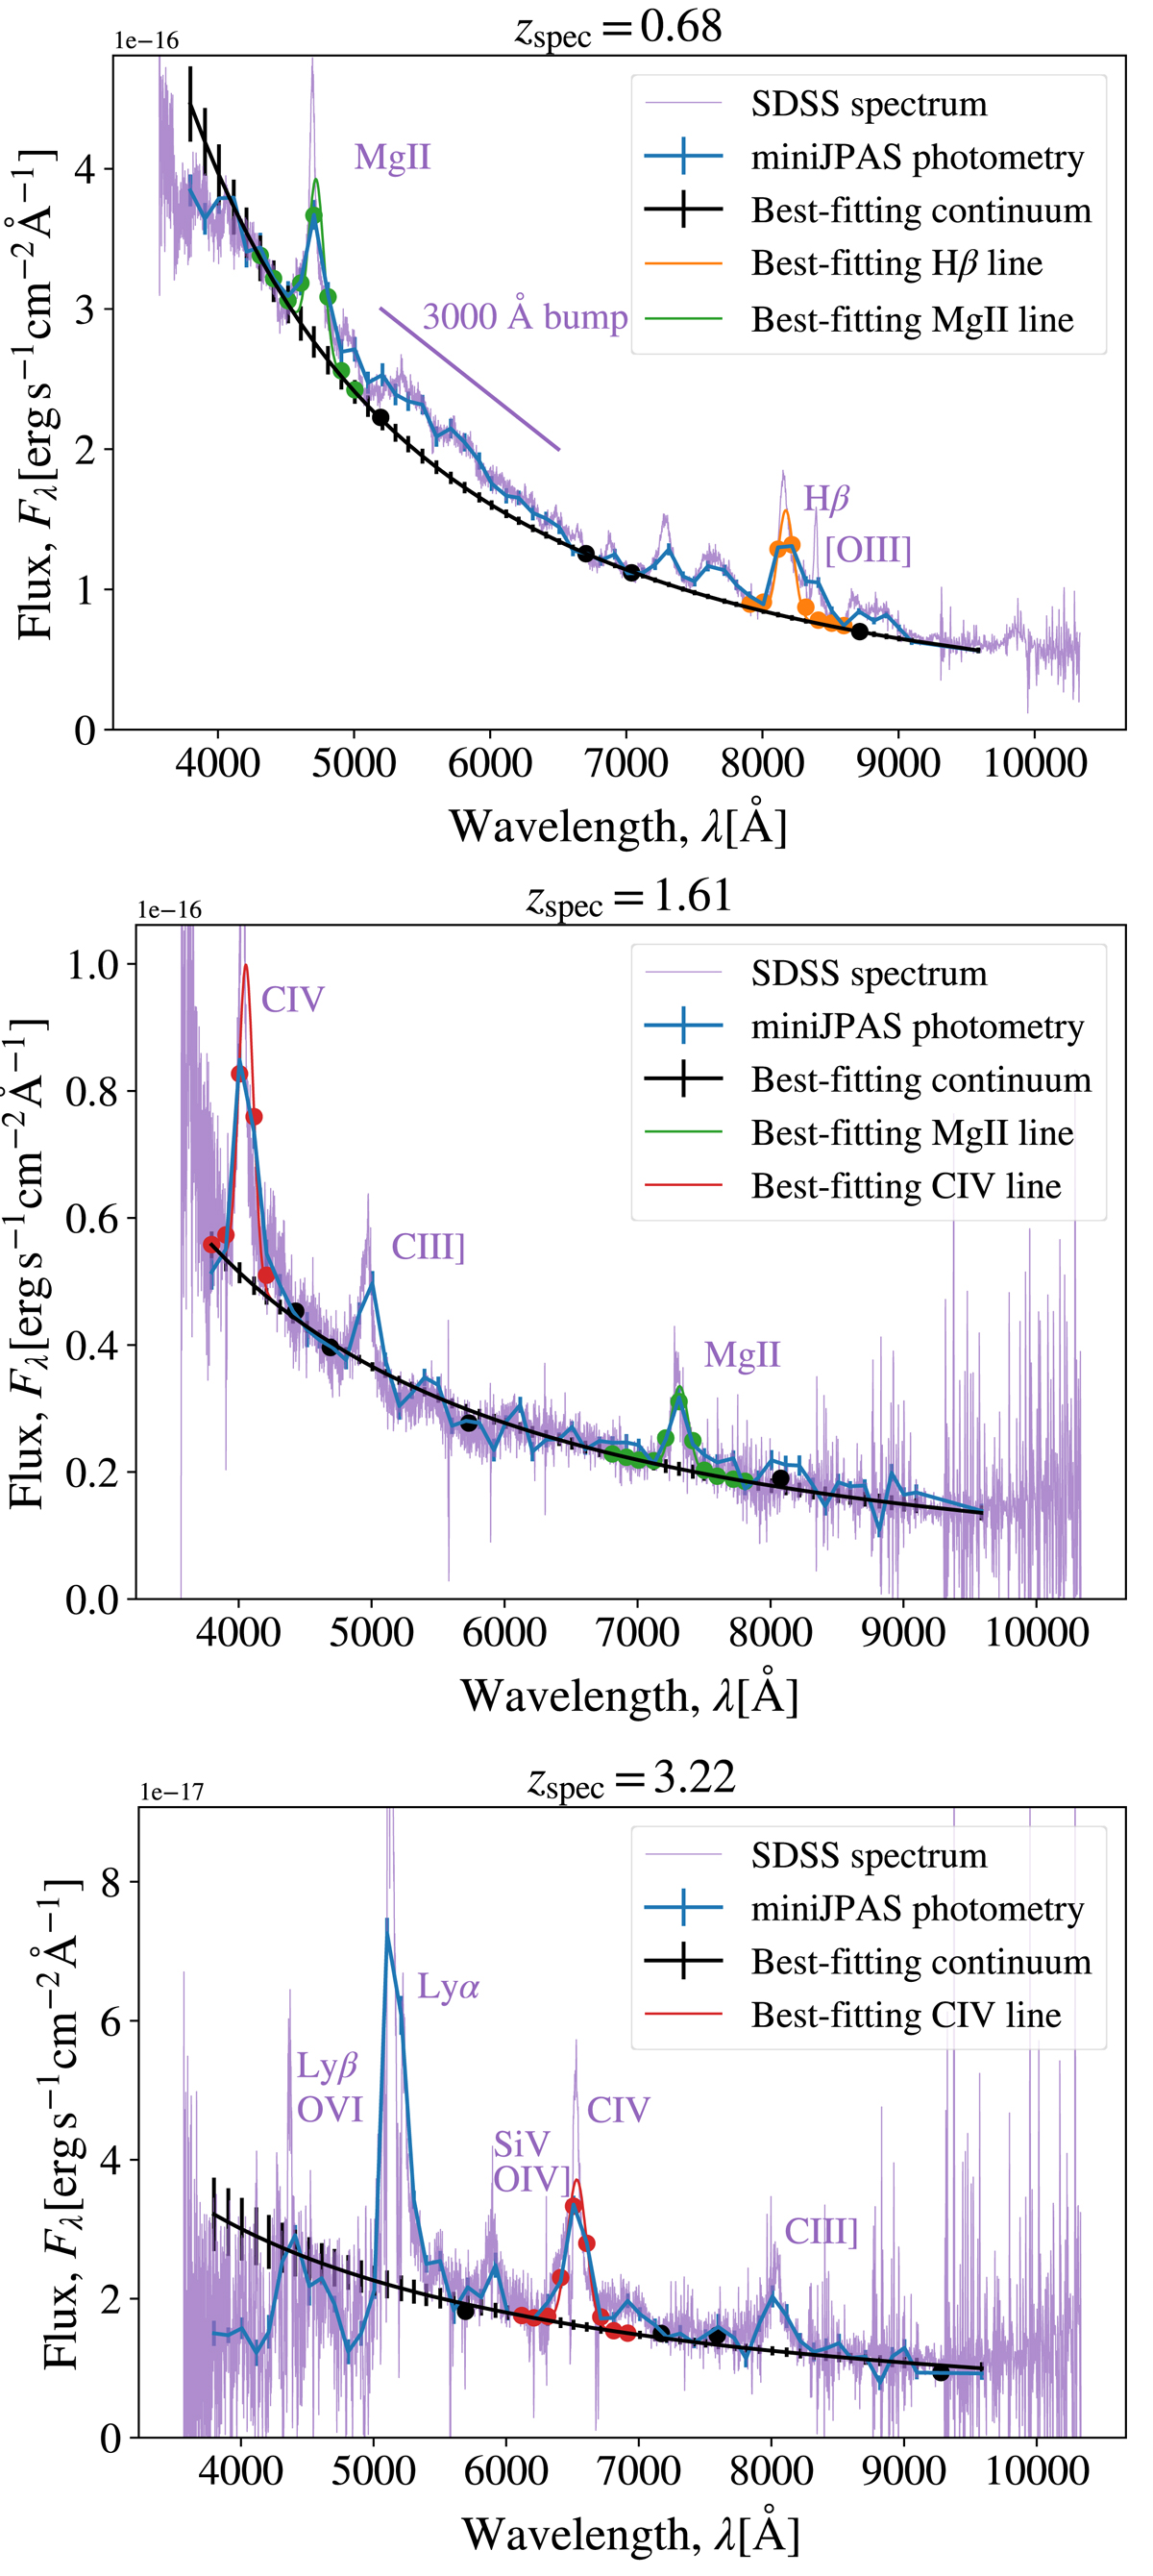
Fig. 2.
Download original image
Photometric decomposition of miniJPAS data from three SDSS quasars. Top, middle, and bottom panels: results for a quasar at low, intermediate, and high redshift, respectively. Blue and purple lines show miniJPAS photospectra and SDSS spectra, respectively, black lines display best-fitting continua, and orange, green, and red lines denote best-fitting Hβ, Mg II, and C IV emission lines. Error bars show 1σ-equivalent uncertainties. Despite the limited spectral resolution of J-PAS filters, we can readily see that best-fitting lines precisely capture the broad component of quasar emission lines in SDSS spectra.
Current usage metrics show cumulative count of Article Views (full-text article views including HTML views, PDF and ePub downloads, according to the available data) and Abstracts Views on Vision4Press platform.
Data correspond to usage on the plateform after 2015. The current usage metrics is available 48-96 hours after online publication and is updated daily on week days.
Initial download of the metrics may take a while.