Fig. 2.
Download original image
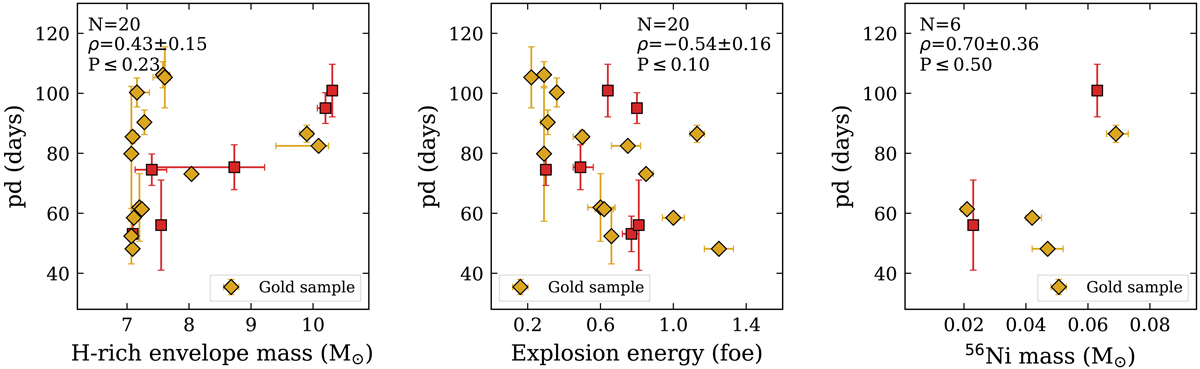
Correlations between pd and three physical parameters: MH, env (left panel), E (middle panel), and MNi (right panel). The yellow and red markers refer to the results obtained from the CSP-I SN II sample (yellow markers indicate gold events). Each subplot contains the number of events (N), the Pearson correlation coefficient (ρ), and the probability of detecting a correlation by chance (P) using the full sample.
Current usage metrics show cumulative count of Article Views (full-text article views including HTML views, PDF and ePub downloads, according to the available data) and Abstracts Views on Vision4Press platform.
Data correspond to usage on the plateform after 2015. The current usage metrics is available 48-96 hours after online publication and is updated daily on week days.
Initial download of the metrics may take a while.