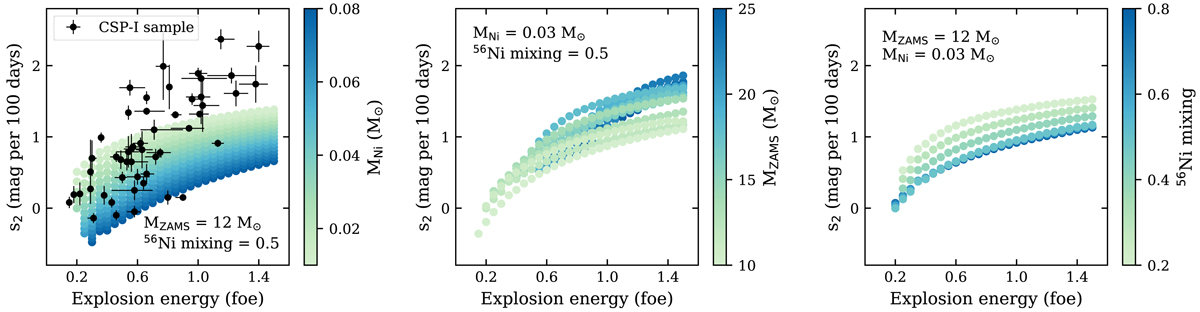
Fig. A.4.
Download original image
Declination rate during the plateau (s2) measured from the synthetic bolometric LCs as a function of explosion energy. The physical parameters not being varied are presented in each subplot together with their fixed values. Each subplot shows the influence of the other physical parameters: MNi (left panel), MZAMS (middle panel), and 56Ni mixing (right panel). Only models with optd values smaller than 160 days are analysed. Black dots represent the observations from the CSP-I SN II sample. Some observations fall outside the range of the model parameters due to the fixed physical parameters. Changes in the fixed values represent different ranges of model parameters.
Current usage metrics show cumulative count of Article Views (full-text article views including HTML views, PDF and ePub downloads, according to the available data) and Abstracts Views on Vision4Press platform.
Data correspond to usage on the plateform after 2015. The current usage metrics is available 48-96 hours after online publication and is updated daily on week days.
Initial download of the metrics may take a while.