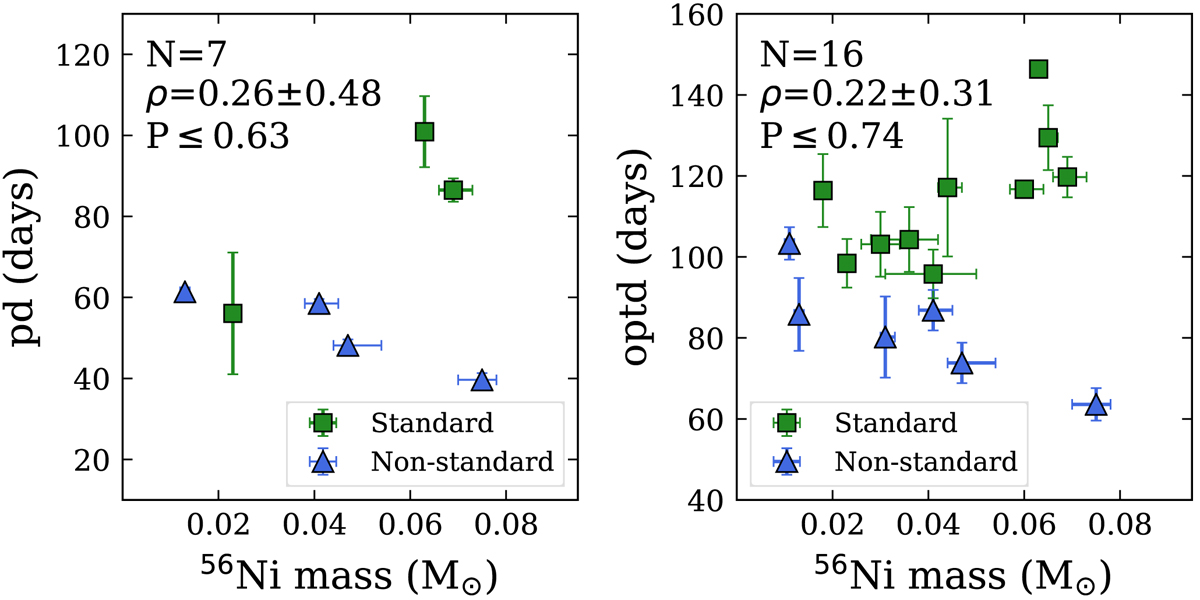
Fig. 10.
Download original image
Correlations between physical and observed parameters using the results from non-standard pre-SN models. Left panel: MNi versus pd. Right panel: MNi versus optd. Each subplot contains the number of events (N), the Pearson correlation coefficient (ρ), and the probability of detecting a correlation by chance (P). Blue triangles show the results obtained using non-standard pre-SN models, while green squares indicate results from standard evolution. SNe labelled as ‘non-standard’ have Bayes factors greater than 101/2.
Current usage metrics show cumulative count of Article Views (full-text article views including HTML views, PDF and ePub downloads, according to the available data) and Abstracts Views on Vision4Press platform.
Data correspond to usage on the plateform after 2015. The current usage metrics is available 48-96 hours after online publication and is updated daily on week days.
Initial download of the metrics may take a while.