Fig. 7.
Download original image
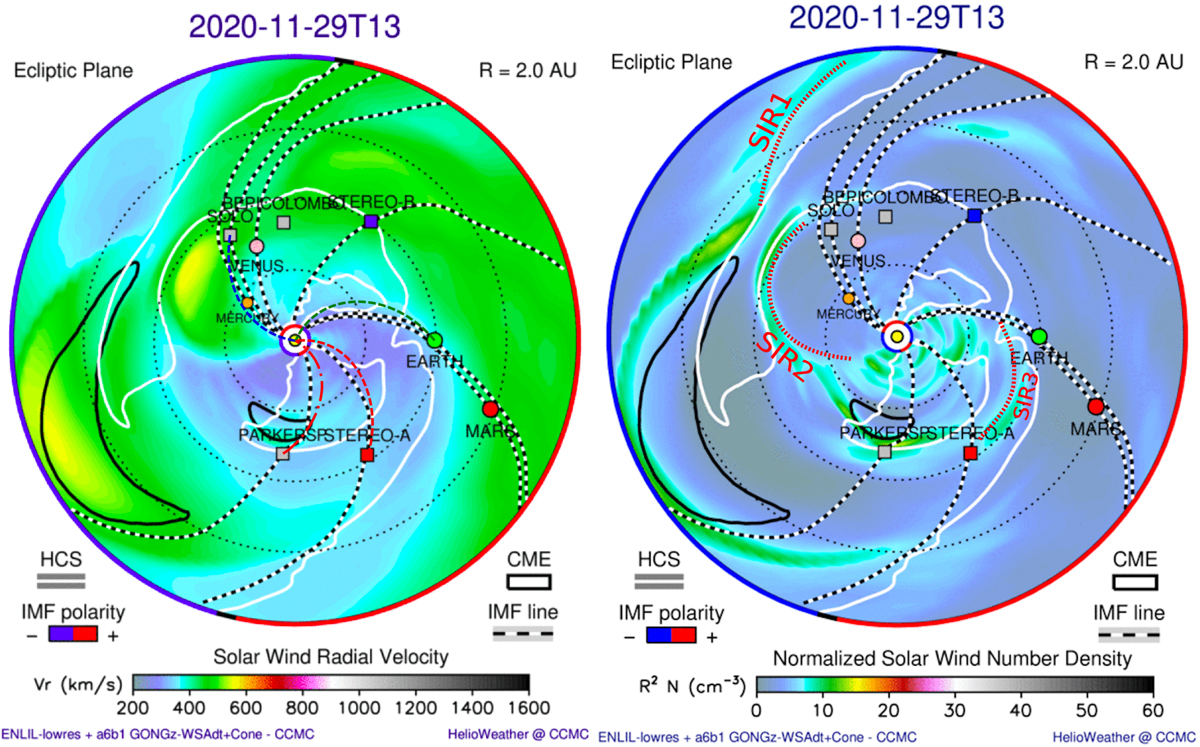
Plots from the ENLIL simulation in the ecliptic plane near the time of the eruption on November 29. Left panel: solar wind radial velocity contours and the right panel the normalized solar wind number density. Black and white dashed lines show the simulated magnetic connectivity of the different spacecraft around the particle release time. In the left panel we also show the Parker spirals connecting the spacecraft to the solar surface (see Fig. 1) and in the right panel we mark regions where SIRs are likely developed. The traced ICMEs are outlined by a black contour. The white lines represent the HCS, which separates the regions with opposite magnetic polarity, shown in blue (negative) or red (positive) on the outer edge of the simulation region. The Sun in the centre is not to scale.
Current usage metrics show cumulative count of Article Views (full-text article views including HTML views, PDF and ePub downloads, according to the available data) and Abstracts Views on Vision4Press platform.
Data correspond to usage on the plateform after 2015. The current usage metrics is available 48-96 hours after online publication and is updated daily on week days.
Initial download of the metrics may take a while.