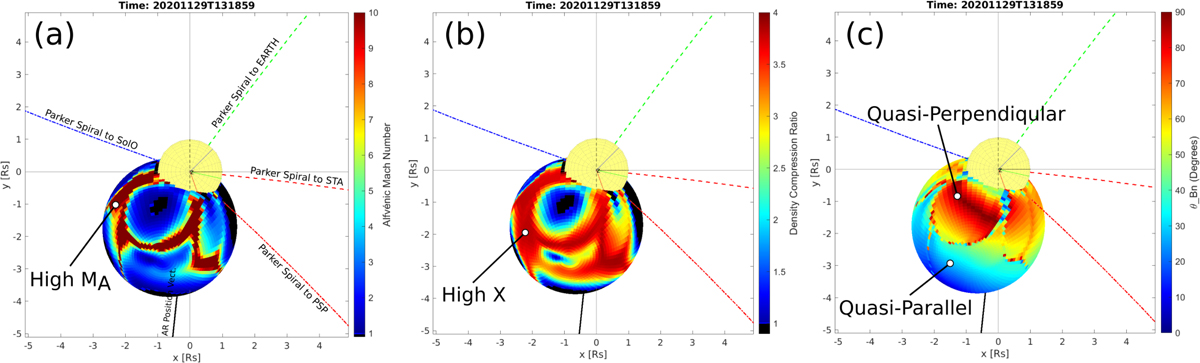
Fig. 6.
Download original image
Selected snapshots of the modelled shock wave parameters in 3D plotted along the reconstructed pressure wavefront surface. The Sun (yellow sphere) is plotted to scale at the centre and the coloured meridians visible on the surface represent the solar central meridian as viewed from STEREO-A (red) and Earth (green). The reconstructed pressure wavefront surface at 13:19 UT is shown and the different shock parameters plotted on the wavefront surface are: the Alfvén Mach number (MA) in (a), the density compression ratio (X) in (b), and the angle between the shock normal and the upstream magnetic field (θBN) in (c). The nominal Parker spiral field lines connecting the Sun surface to each spacecraft are plotted on each panel.
Current usage metrics show cumulative count of Article Views (full-text article views including HTML views, PDF and ePub downloads, according to the available data) and Abstracts Views on Vision4Press platform.
Data correspond to usage on the plateform after 2015. The current usage metrics is available 48-96 hours after online publication and is updated daily on week days.
Initial download of the metrics may take a while.