Fig. 2.
Download original image
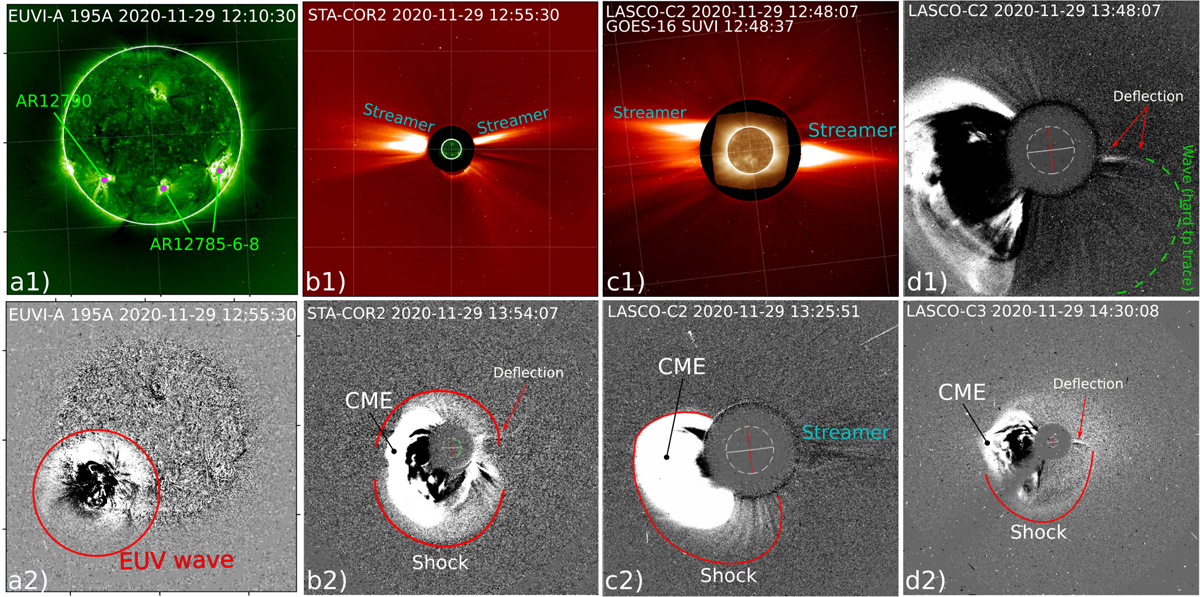
Selected snapshots of EUV and WL coronagraphic observations before and during the 2020 November 29 event. Panels a1, a2: EUV observations from STEREO-A/EUVI at 195 Å: (a1) Image before the event where we mark the ARs of interest discussed in the text. (a2) Running-difference image during the event, with the EUV wave encircled. Panels b–d: coronagraphic observations from STEREO-A/COR2 and LASCO-C2, respectively; (b1) and (c1) are images before the event where we mark the location of streamers and (b2), (c2), and (d) are running-difference images during the event where we indicate the CME and we outline the location of the shock wave. Here we mark the locations where the shock interacted with the streamers and a deflection was observed. The associated movie is available online.
Current usage metrics show cumulative count of Article Views (full-text article views including HTML views, PDF and ePub downloads, according to the available data) and Abstracts Views on Vision4Press platform.
Data correspond to usage on the plateform after 2015. The current usage metrics is available 48-96 hours after online publication and is updated daily on week days.
Initial download of the metrics may take a while.