Fig. A.1.
Download original image
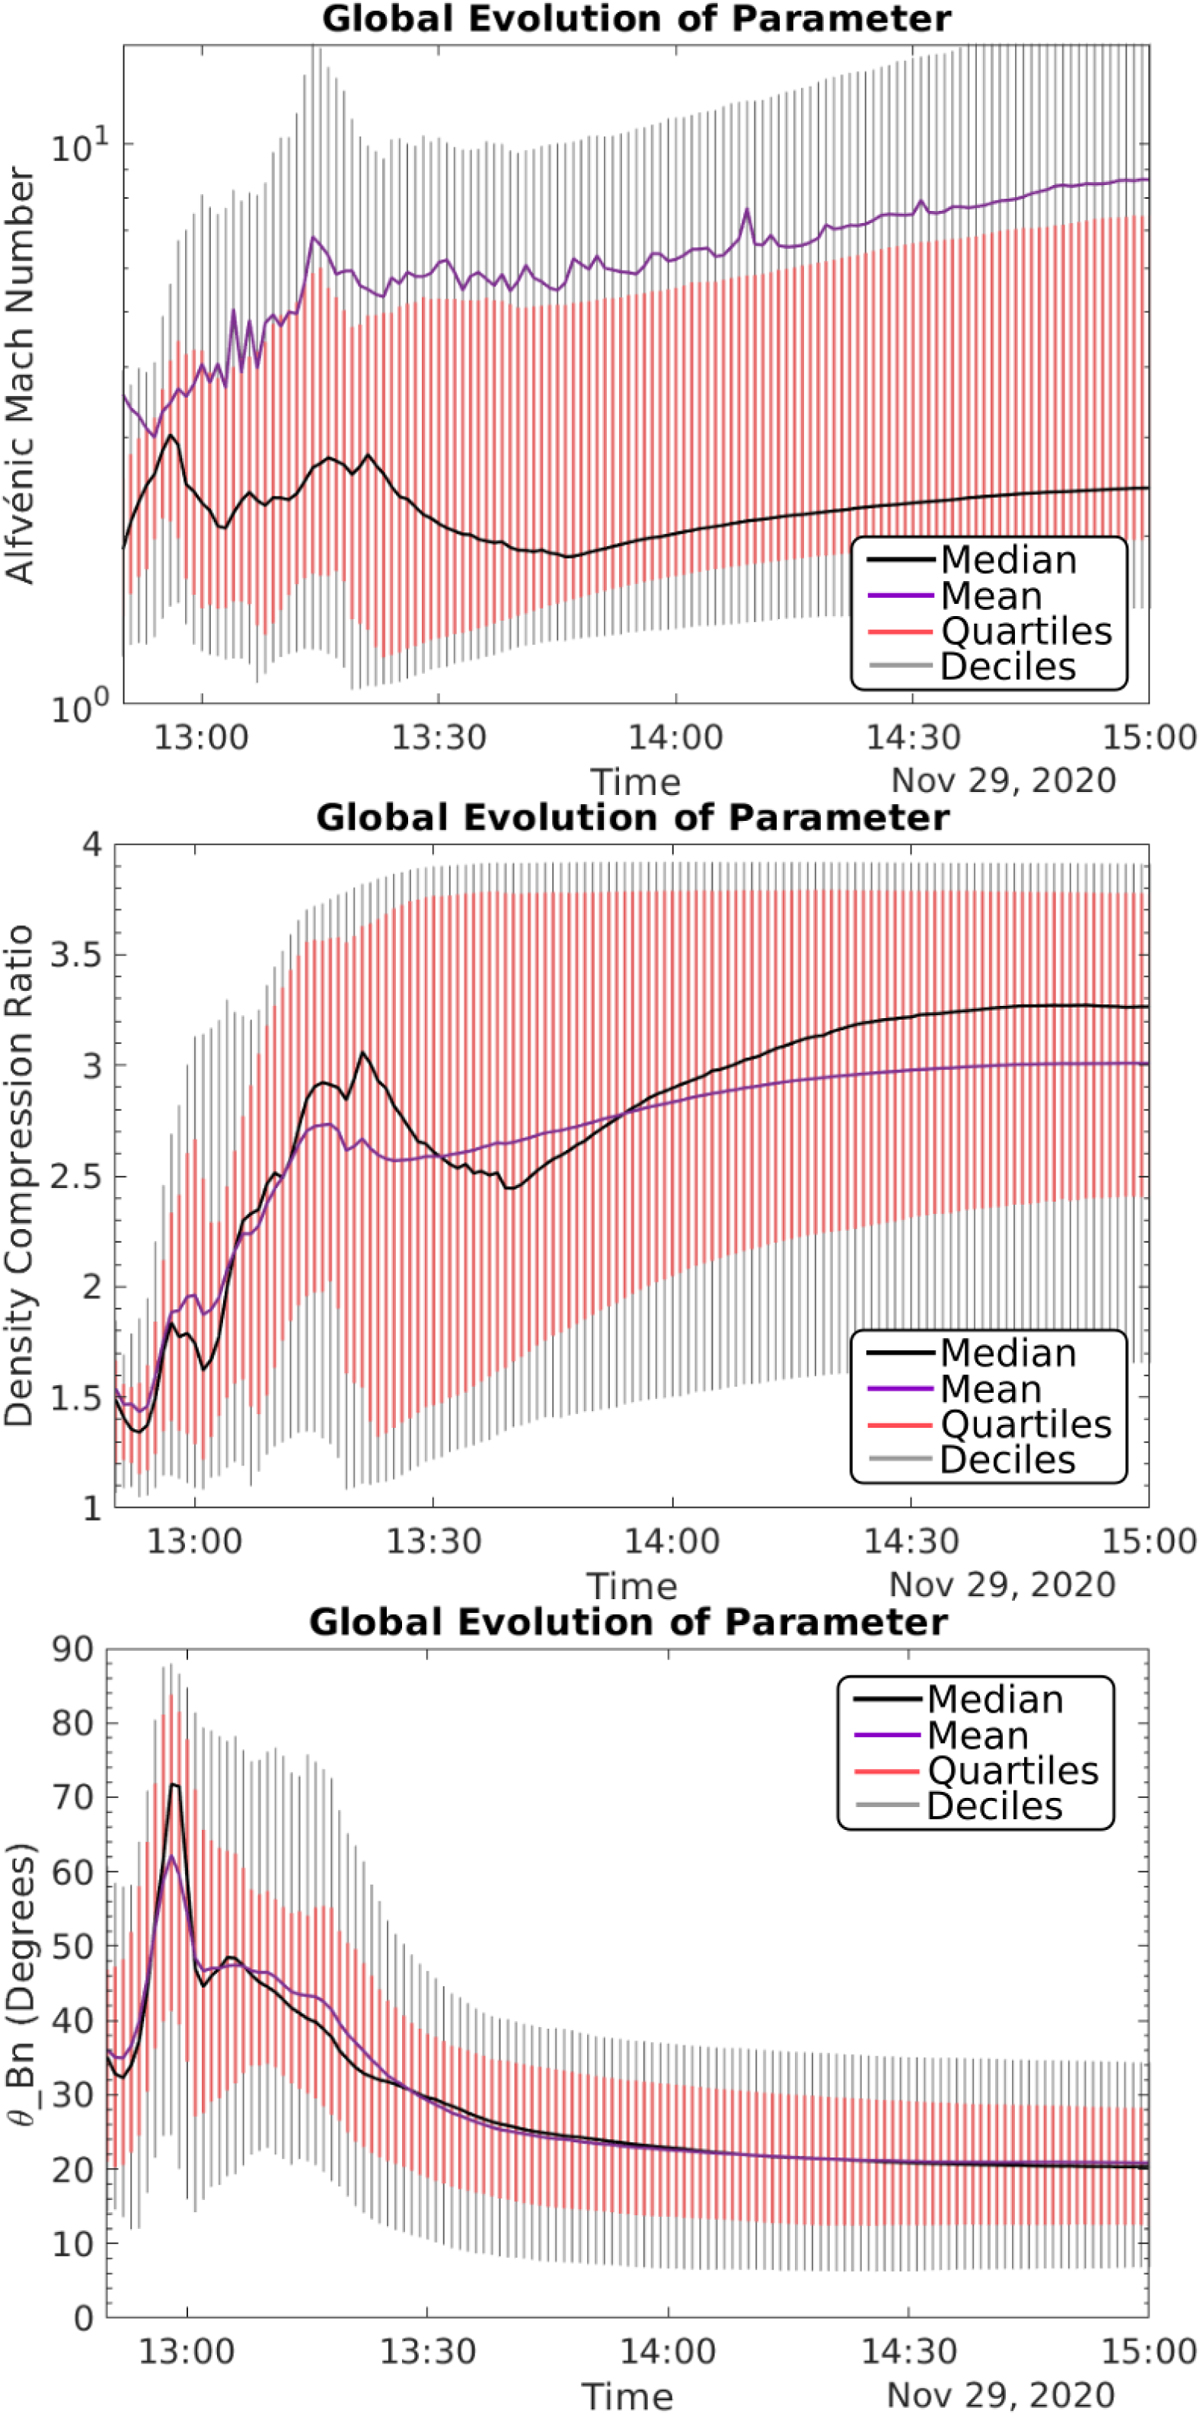
Temporal evolution of the MA (top panel), X (middle panel), and θBN (bottom panel) obtained from the shock wave modelling. The time-varying distribution characteristics of the shock parameters are presented in each panel. The median values are depicted with the black lines, the mean with purple lines, and the first and third quartile and the first and ninth decile values are indicated with the red and grey vertical bars, respectively.
Current usage metrics show cumulative count of Article Views (full-text article views including HTML views, PDF and ePub downloads, according to the available data) and Abstracts Views on Vision4Press platform.
Data correspond to usage on the plateform after 2015. The current usage metrics is available 48-96 hours after online publication and is updated daily on week days.
Initial download of the metrics may take a while.