Fig. 11.
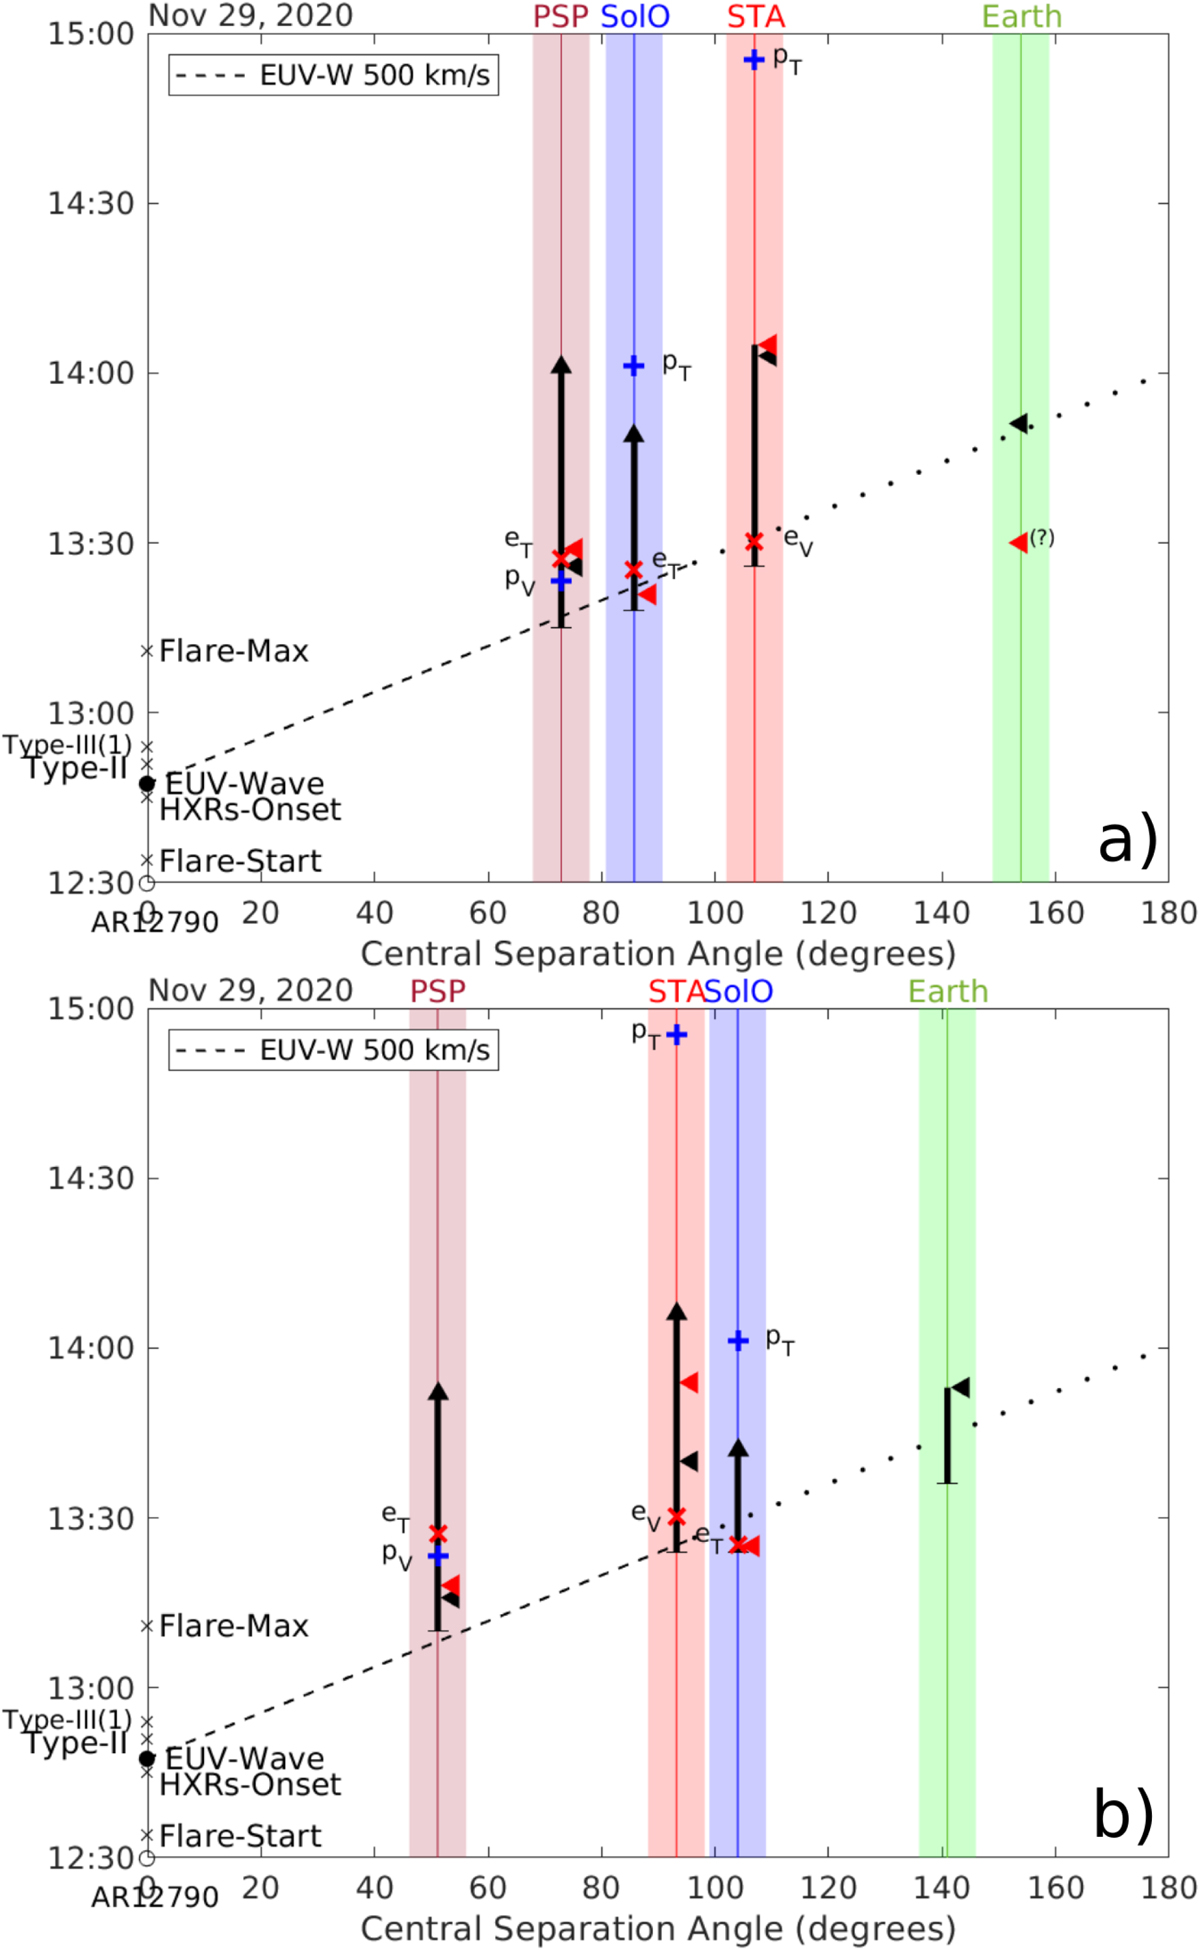
Download original image
Comparison of the SEP release times with the characteristic times of the shock wave evolution at the field lines connecting to the spacecraft. For each spacecraft, the angular distance of the magnetic footpoint from the flare location is shown by the vertical bars, which assume an uncertainty of ±5 deg. The time interval when the pressure wave connects to the spacecraft for the first time and the other shock-related characteristic times are shown with the vertical black bar. The time when the shock strength is maximum or reaches a plateau is shown with the black arrowheads at the end of the bar. The time when the connected regions steepen into a shock wave and when the connected shock regions become supercritical on average are shown with the black and red arrowheads beside the bars, respectively. For each spacecraft, the energetic electron and proton release times are shown with red crosses and blue plus symbols and the label subscripts note the method used for the release time determination (see Table 2 for details). For (a) we used the connectivity estimates from the PS+MAS and for (b) we used those from ENLIL+MAS. The dashed (dotted) line shows the angular distance of the EUV wave from the flare location for an average propagation speed of 500 km s−1.
Current usage metrics show cumulative count of Article Views (full-text article views including HTML views, PDF and ePub downloads, according to the available data) and Abstracts Views on Vision4Press platform.
Data correspond to usage on the plateform after 2015. The current usage metrics is available 48-96 hours after online publication and is updated daily on week days.
Initial download of the metrics may take a while.