Fig. 10.
Download original image
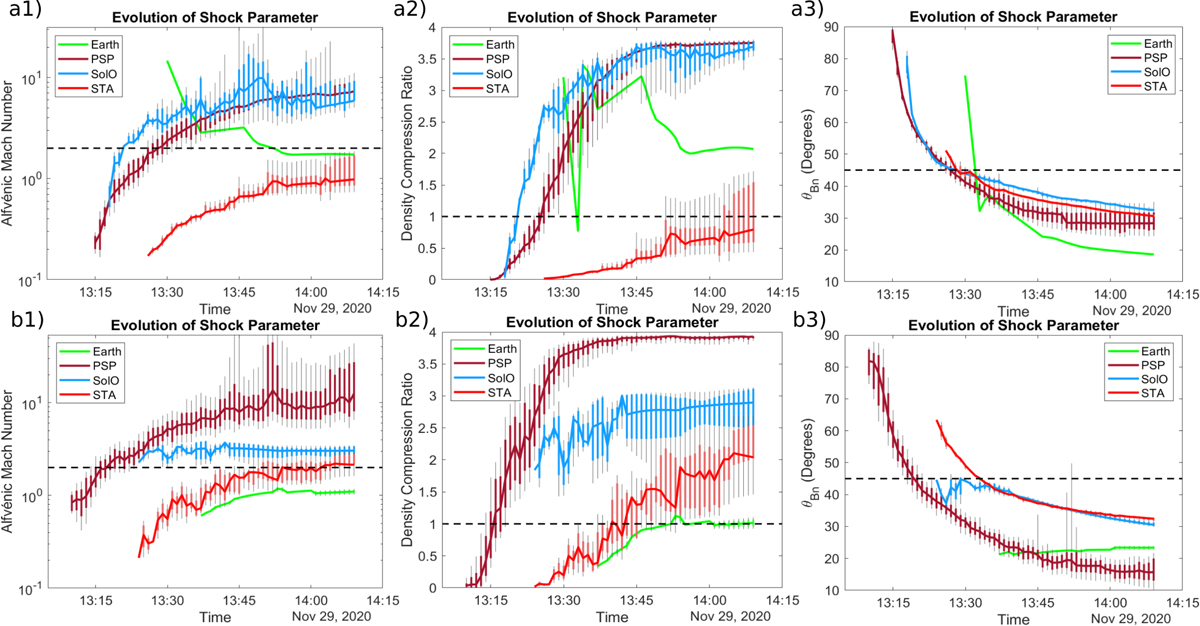
Temporal evolution of the shock parameters (MA, X, and θBN) at the field lines magnetically connected to the spacecraft: panels a1–a3 (top row) and b1–b3 (bottom row) respectively show the evolution of the shock parameters for the connected field lines from PS+MAS and ENLIL+MAS. The time-varying distribution characteristics of the shock parameters are presented in each panel. The median values are depicted with the solid lines and the first and third quartile and first and ninth decile are respectively indicated with the coloured and grey vertical bars. The horizontal dashed lines in each panel show: the supercritical limit (Mc > 2) in panels a1 and b1, the limit of shock formation (X > 1) in panels a2 and b2, and the oblique θBN in panels a3 and b3.
Current usage metrics show cumulative count of Article Views (full-text article views including HTML views, PDF and ePub downloads, according to the available data) and Abstracts Views on Vision4Press platform.
Data correspond to usage on the plateform after 2015. The current usage metrics is available 48-96 hours after online publication and is updated daily on week days.
Initial download of the metrics may take a while.