Fig. A.2.
Download original image
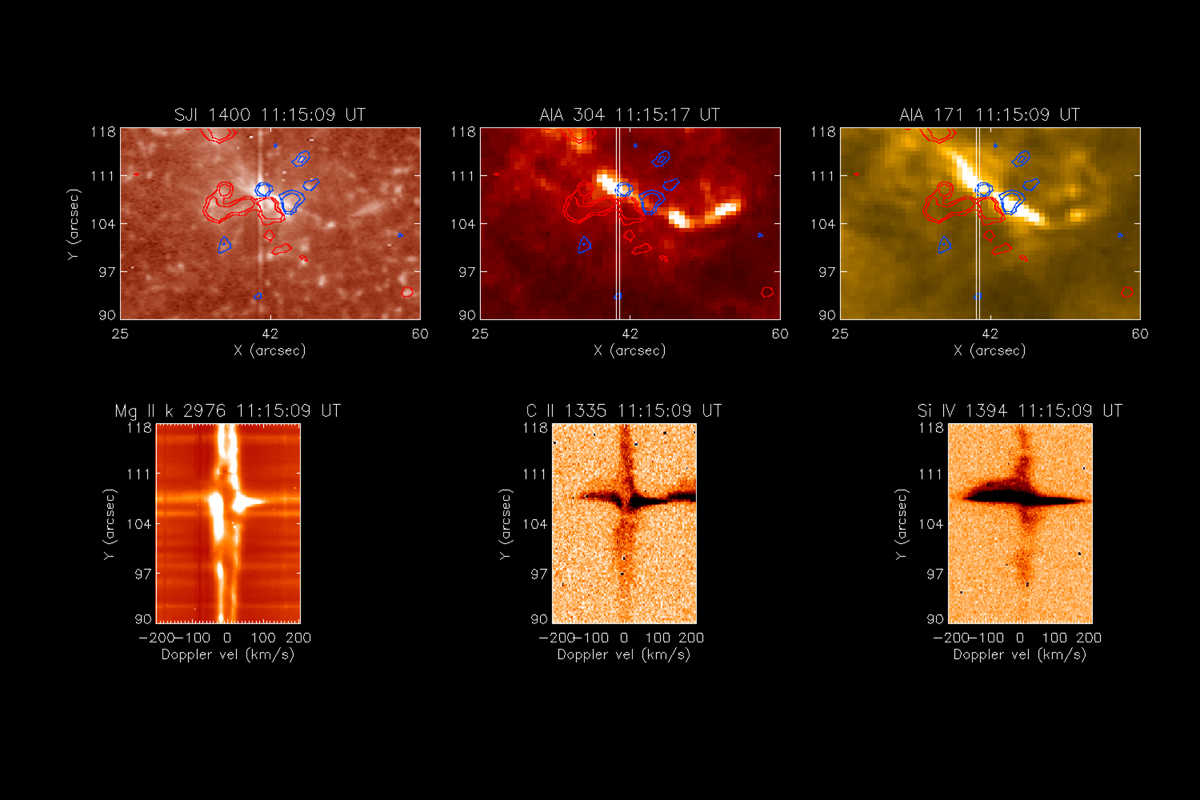
Co-temporal animation of imaging and spectral slit data: Top: IRIS SJI 1400, AIA 304 and 171 images. The red and blue contours trace magnetic fluxes at ±25 G and ±50 G. Bottom: Mg II k 2796, C II 1335, and Si IV 1394 intensity images along the IRIS slit. The position of the slit is visible as a vertical strip on the SJI 1400, and is overplotted as two vertical lines on the AIA 304 and 171 images.
Current usage metrics show cumulative count of Article Views (full-text article views including HTML views, PDF and ePub downloads, according to the available data) and Abstracts Views on Vision4Press platform.
Data correspond to usage on the plateform after 2015. The current usage metrics is available 48-96 hours after online publication and is updated daily on week days.
Initial download of the metrics may take a while.