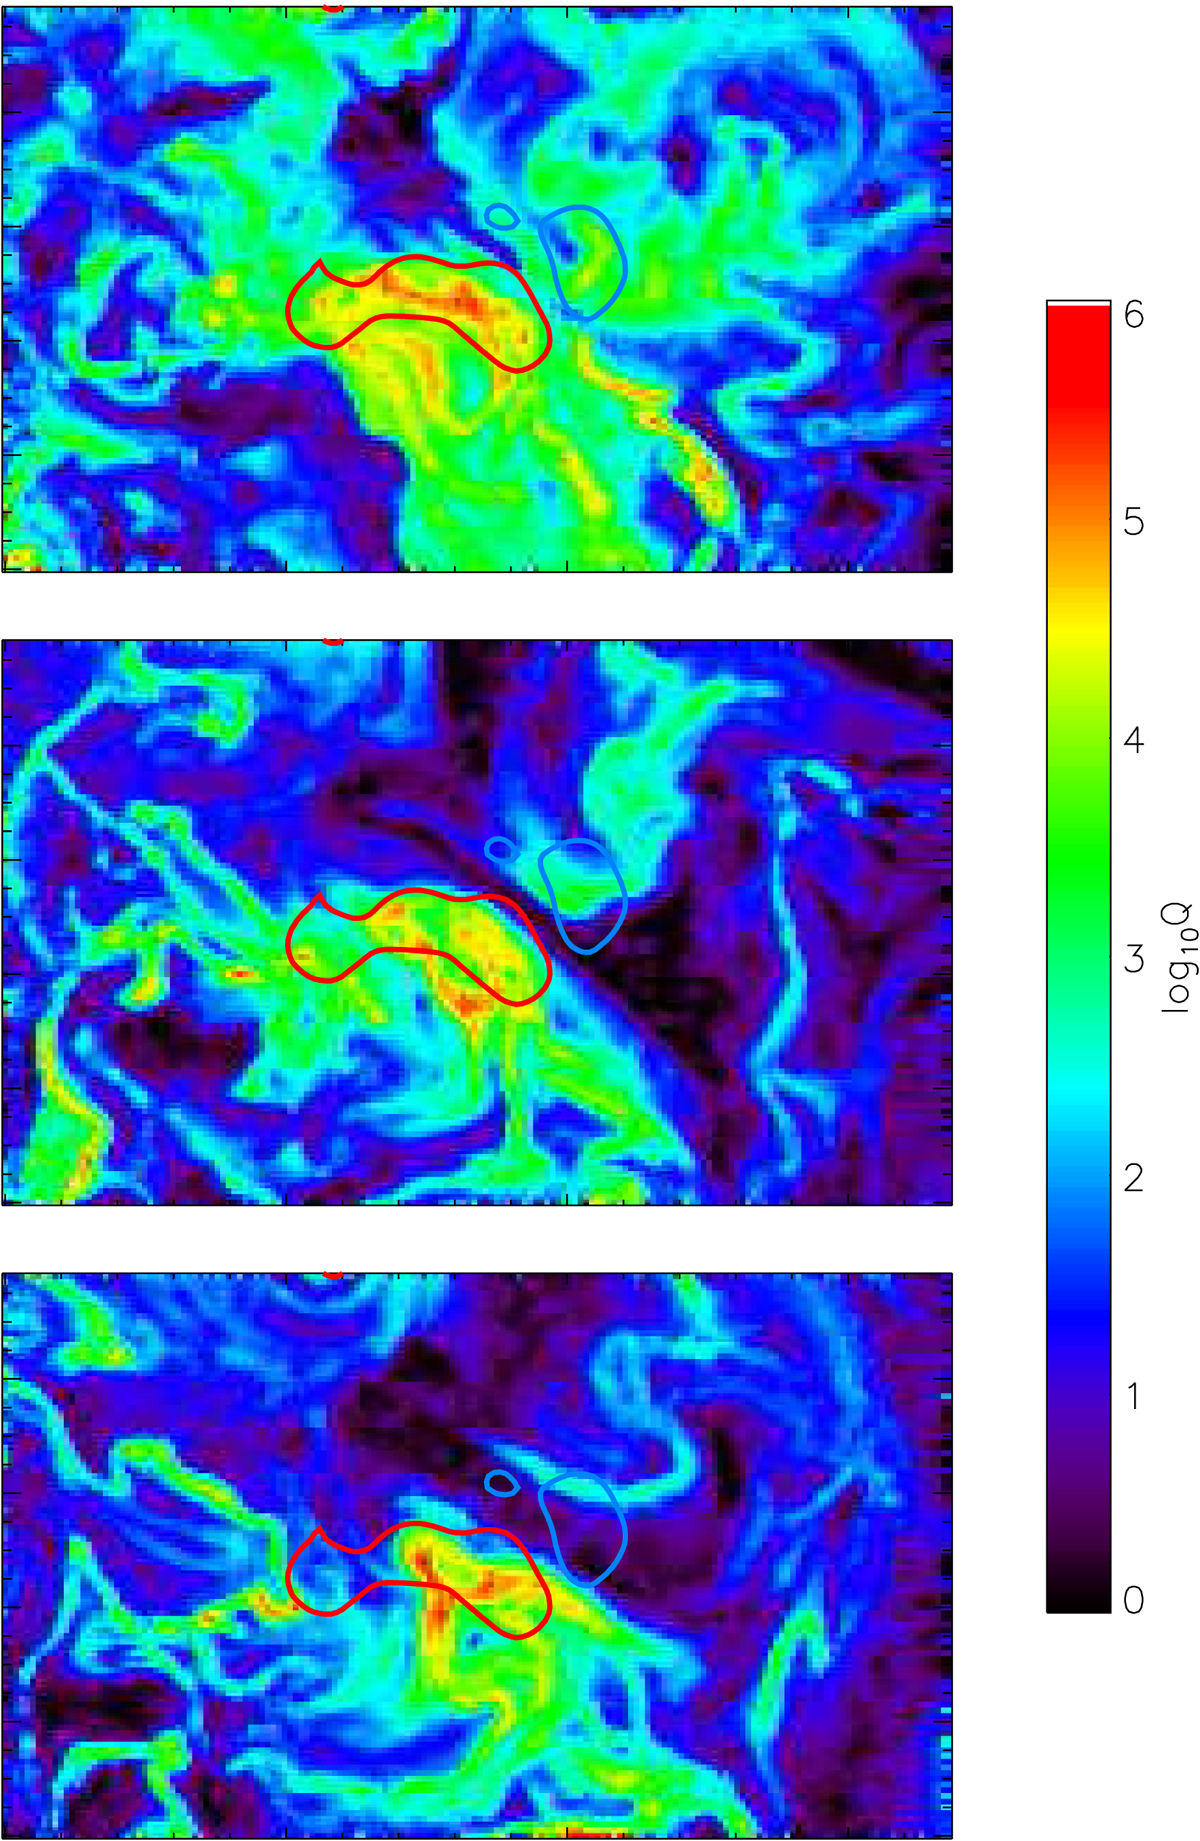
Fig. 7.
Download original image
Three frames showing the spatial distribution of the derived log10Q values in different horizontal planes above the magnetogram surface. The top panel corresponds to a plane at a height of 110 km, the middle at 1105 km, and the bottom at 2764 km. The blue and red contours denote the negative and positive photospheric magnetic field, respectively at values of Bz = ±50 G. The images are smoothed with a boxcar of width 3 × 3 px2.
Current usage metrics show cumulative count of Article Views (full-text article views including HTML views, PDF and ePub downloads, according to the available data) and Abstracts Views on Vision4Press platform.
Data correspond to usage on the plateform after 2015. The current usage metrics is available 48-96 hours after online publication and is updated daily on week days.
Initial download of the metrics may take a while.