Fig. 6.
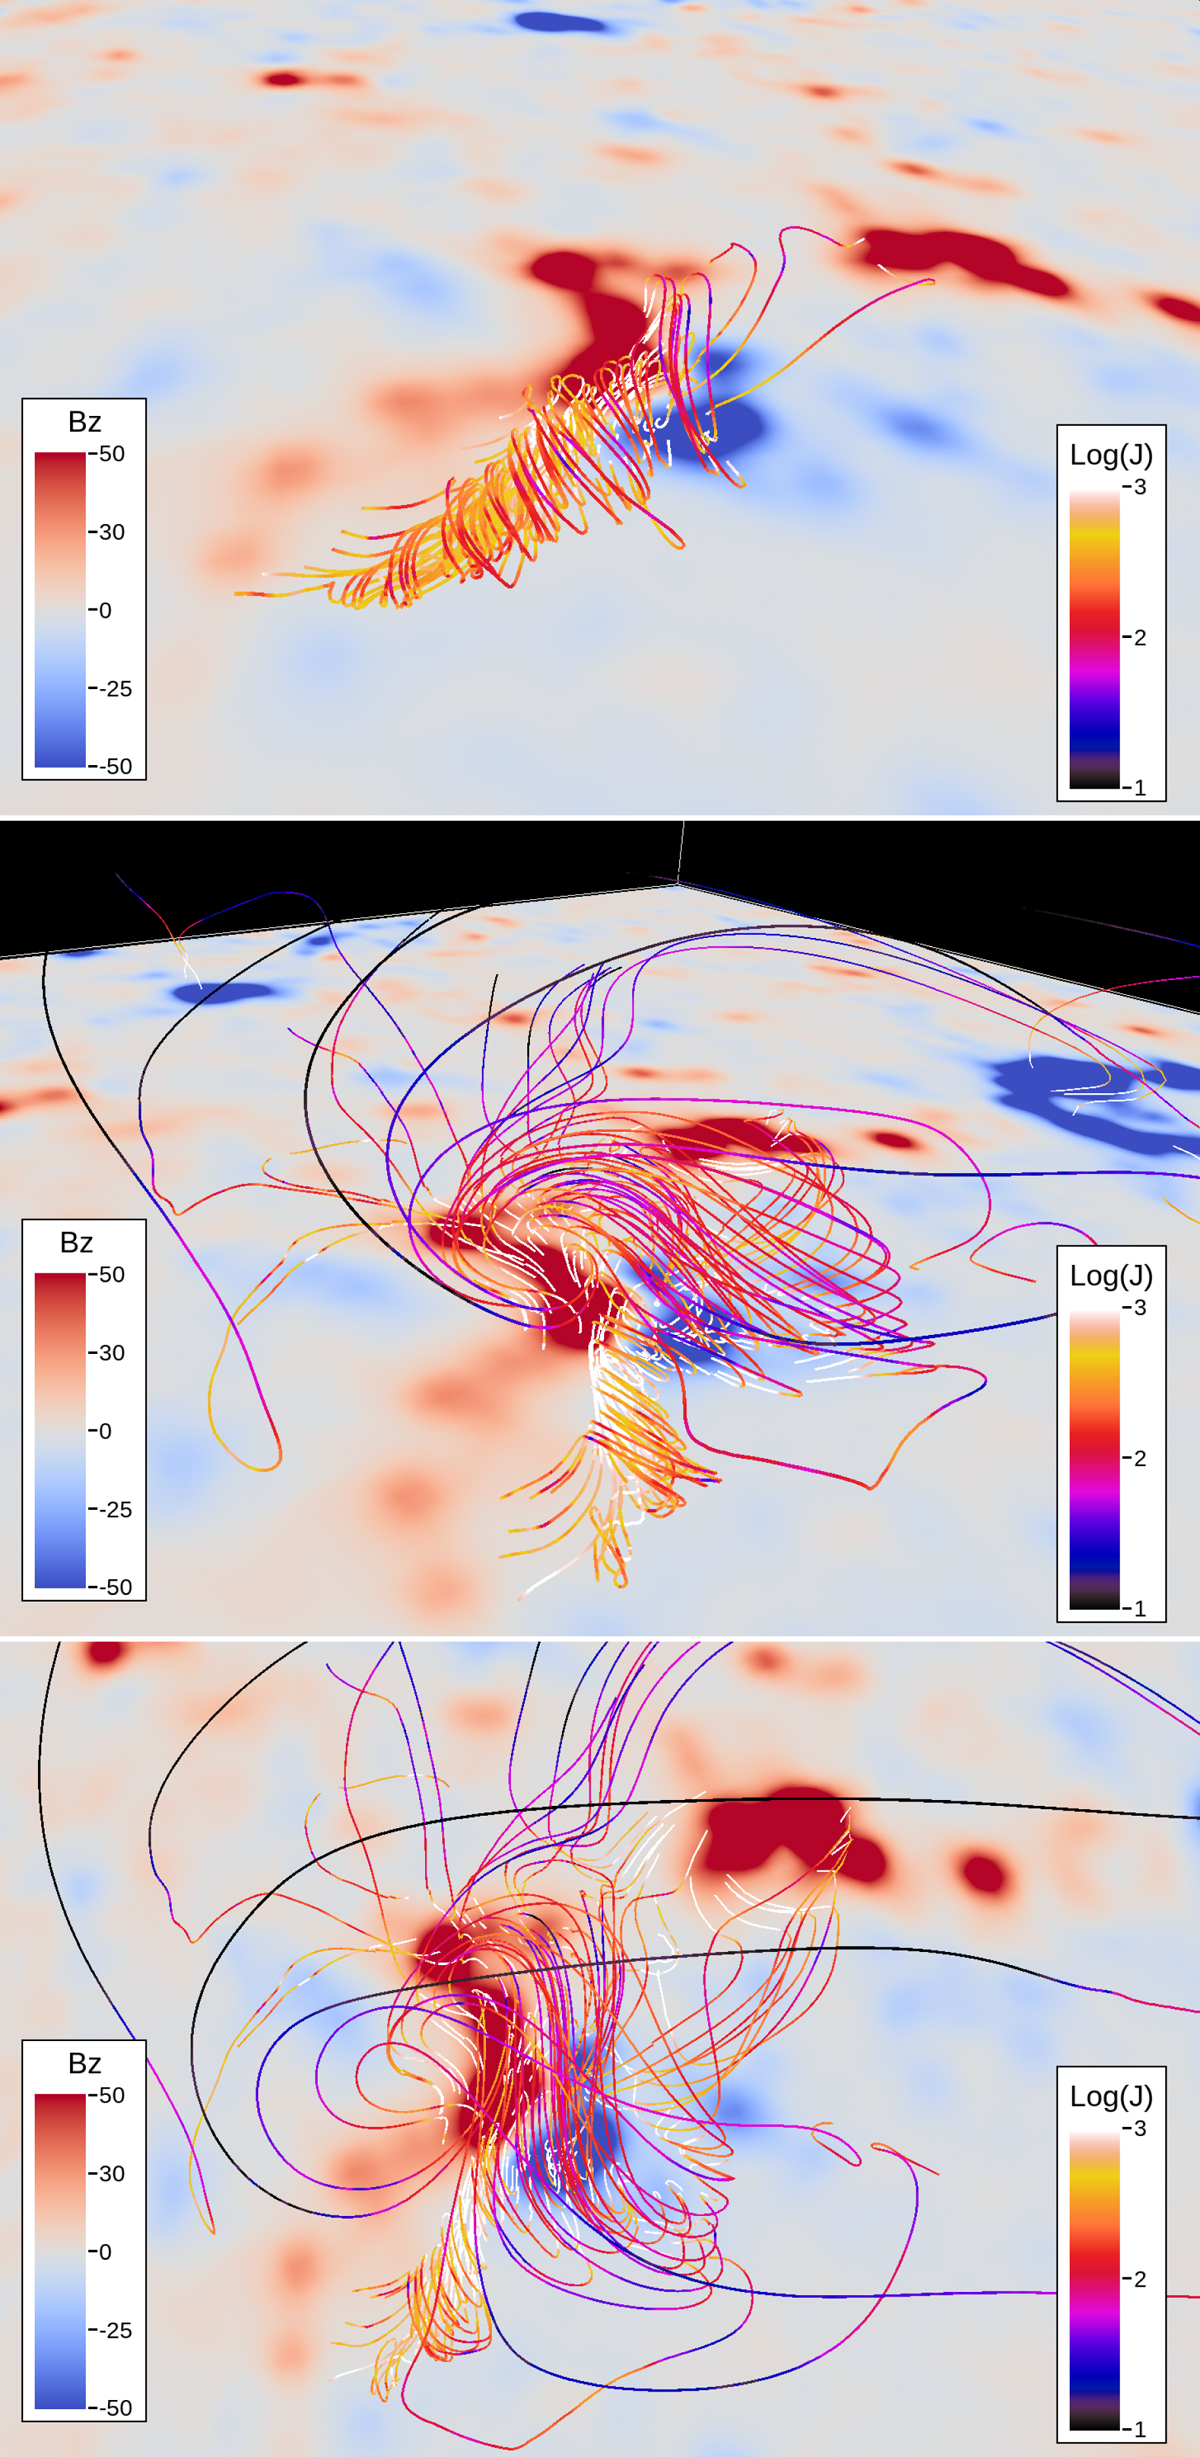
Download original image
Illustrations of the field lines above the polarity inversion line for the simulation where ζ = −175 km2 s−1 at 10:58 UT on 5 April 2017. The field lines are shown at low (top) and high (middle and bottom) heights above the PIL. The colour coding represents the strength of the electric current, defined as J = ∇ × B along the field lines as given in the right-hand side (Log(J) ranging from 1 to 3). The background image represents the photospheric magnetogram where red represents positive flux and blue negative flux in the range ±50 G, left-hand sub-panel.
Current usage metrics show cumulative count of Article Views (full-text article views including HTML views, PDF and ePub downloads, according to the available data) and Abstracts Views on Vision4Press platform.
Data correspond to usage on the plateform after 2015. The current usage metrics is available 48-96 hours after online publication and is updated daily on week days.
Initial download of the metrics may take a while.