Fig. 5.
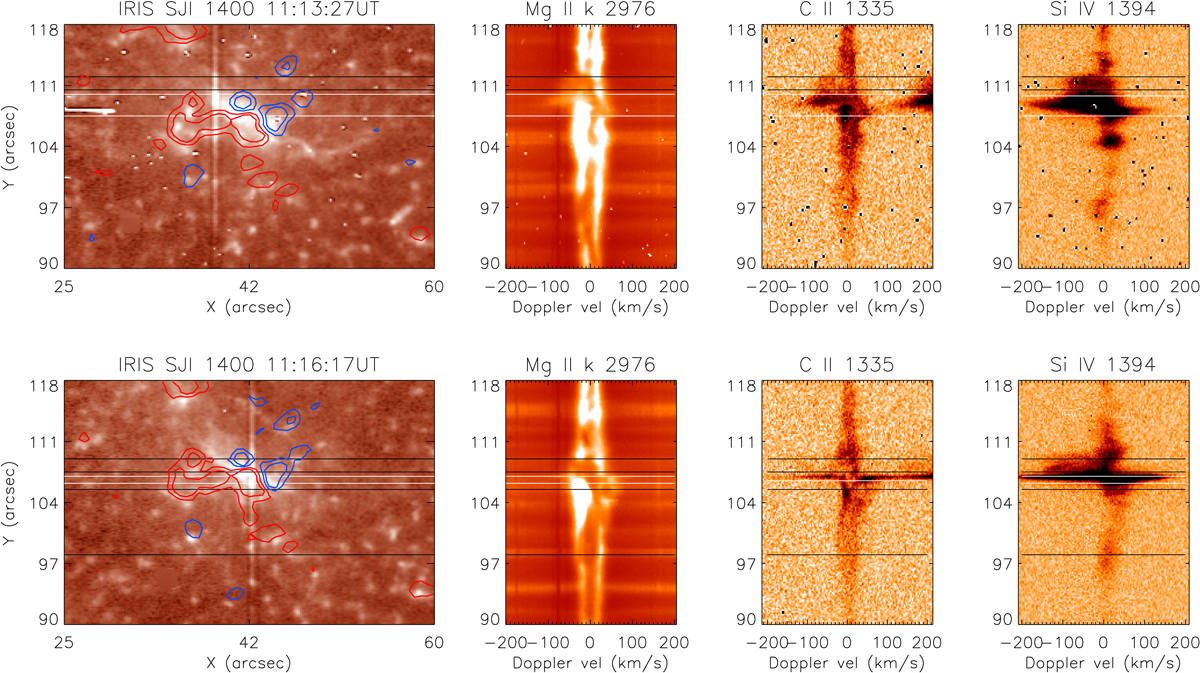
Download original image
IRIS SJI 1400 and spectral-slit images while the IRIS slit scans the eruption region (shown from left to right). The red and blue contours trace magnetic fluxes at ±50 G. The Mg II k 2796 Å, C II 1335 Å, and Si IV 1394 Å intensity along the IRIS slit are recorded at the times of the IRIS SJI images and at the location seen at the projected IRIS slit on the SJIs. The C II and Si IV spectral-slit images are shown in a reversed colour table. The location between the black horizontal lines is where the mini-filament is recorded, while the part along the slit between the white horizontal lines is the reconnection site area.
Current usage metrics show cumulative count of Article Views (full-text article views including HTML views, PDF and ePub downloads, according to the available data) and Abstracts Views on Vision4Press platform.
Data correspond to usage on the plateform after 2015. The current usage metrics is available 48-96 hours after online publication and is updated daily on week days.
Initial download of the metrics may take a while.