Open Access
Fig. 4.
Download original image
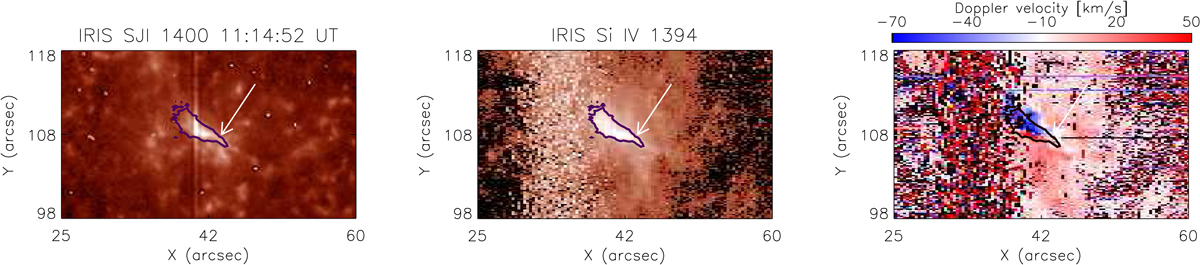
IRIS SJI 1400 image, Si IV 1394 raster intensity, and Doppler velocity images (shown left to right). The contour outlines the micro-flare region in the Si IV 1394 raster image that is also overplotted on the SJI 1400 and Doppler-velocity images. The white arrow points at the reconnection site.
Current usage metrics show cumulative count of Article Views (full-text article views including HTML views, PDF and ePub downloads, according to the available data) and Abstracts Views on Vision4Press platform.
Data correspond to usage on the plateform after 2015. The current usage metrics is available 48-96 hours after online publication and is updated daily on week days.
Initial download of the metrics may take a while.