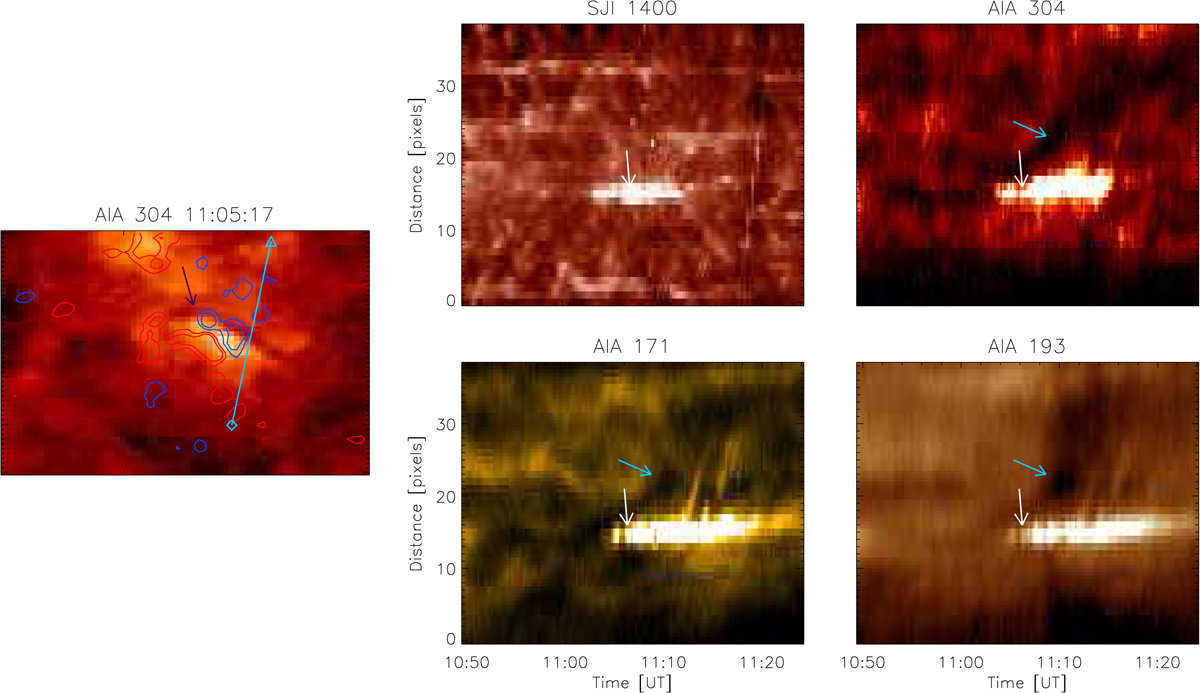
Fig. 3.
Download original image
Temporal evolution of the mini-filament eruption and micro-flare in time slice images. From left to right: AIA 304 image during the mini-filament appearance as a dark elongated feature. A cyan line marks the slice from which the time-slice images in the second and third columns are produced. The square indicates the bottom and the triangle, the top of the slice images. The black arrow points at the mini-filament. The red and blue contours trace magnetic fluxes at ±25 G and ±50 G. Top middle: IRIS SJI 1400 time slice image. The white arrow points at the micro-flare (the same for the AIA images). Bottom middle: AIA 171 time-slice image. Top right: AIA 304 time-slice image, and bottom right: AIA 193 time-slice image. The cyan arrows point at the dimming region. The IRIS pixels are rescaled to the AIA pixel size.
Current usage metrics show cumulative count of Article Views (full-text article views including HTML views, PDF and ePub downloads, according to the available data) and Abstracts Views on Vision4Press platform.
Data correspond to usage on the plateform after 2015. The current usage metrics is available 48-96 hours after online publication and is updated daily on week days.
Initial download of the metrics may take a while.