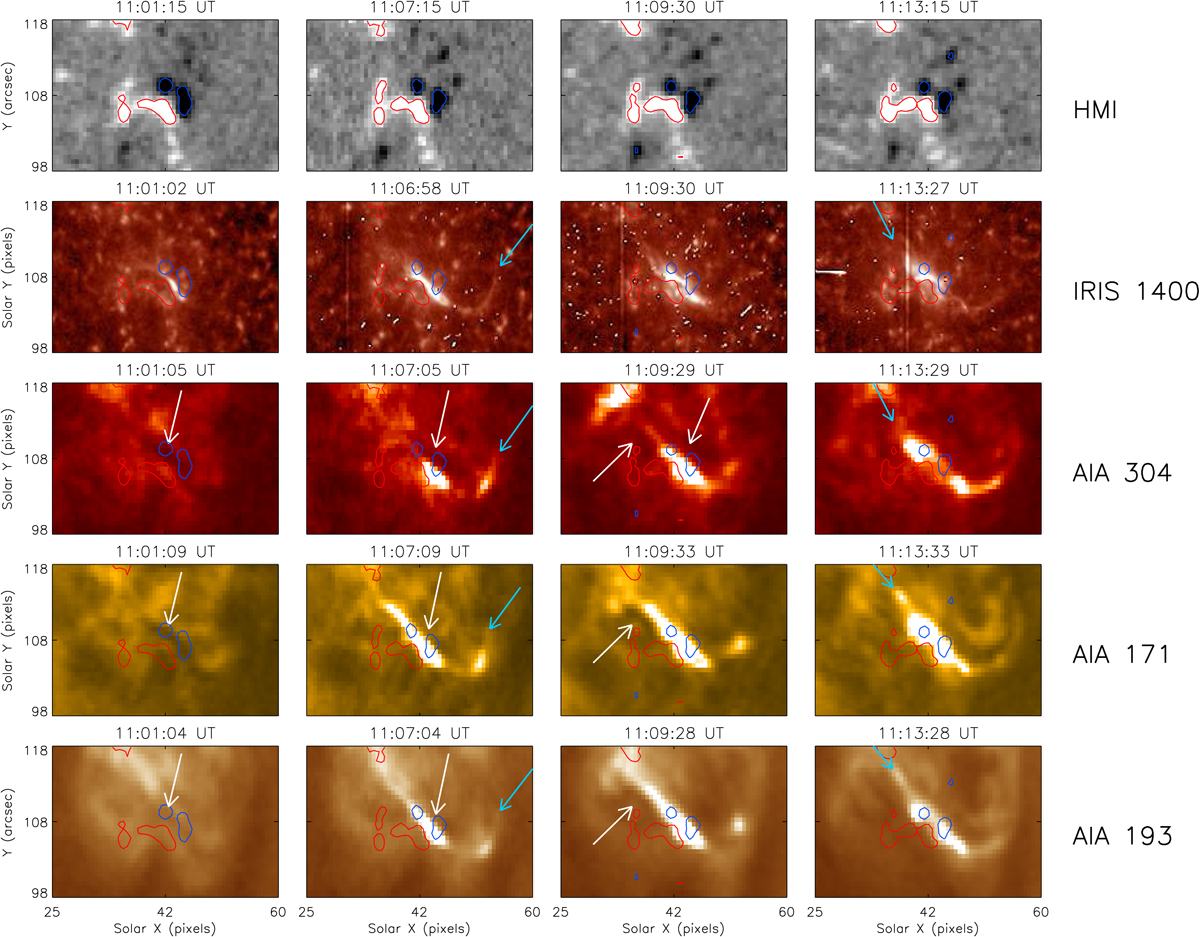
Fig. 2.
Download original image
HMI magnetograms, IRIS SJI 1400, AIA 304, AIA 171, and AIA 193 images showing the evolution of the eruption (in order from top to bottom). The white arrows point at the mini-filament seen in absorption, i.e. the ‘dark feature’. The red and blue contours trace magnetic fluxes at ±50 G. The cyan arrows indicate the hot plasma up-flows seen as bright extensions from the reconnection site.
Current usage metrics show cumulative count of Article Views (full-text article views including HTML views, PDF and ePub downloads, according to the available data) and Abstracts Views on Vision4Press platform.
Data correspond to usage on the plateform after 2015. The current usage metrics is available 48-96 hours after online publication and is updated daily on week days.
Initial download of the metrics may take a while.