Fig. 1.
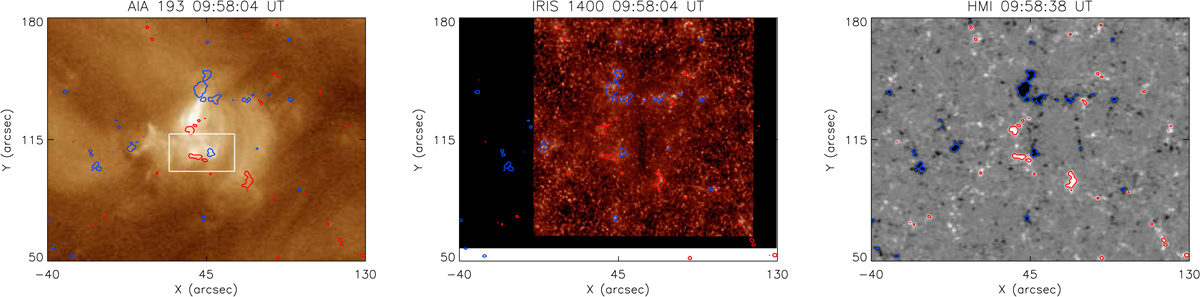
Download original image
Small-scale loop system known as a coronal bright point. Left to right: AIA 193 Å, IRIS SJI 1400, and HMI magnetogram images with the CBP in the centre of the field of view (FOV). The red and blue contours trace magnetic fluxes at ±50 G. The HMI magnetograms are saturated at ±50 G. The white-line square in the first panel outlines the FOV shown in Fig. 2.
Current usage metrics show cumulative count of Article Views (full-text article views including HTML views, PDF and ePub downloads, according to the available data) and Abstracts Views on Vision4Press platform.
Data correspond to usage on the plateform after 2015. The current usage metrics is available 48-96 hours after online publication and is updated daily on week days.
Initial download of the metrics may take a while.