Fig. 8.
Download original image
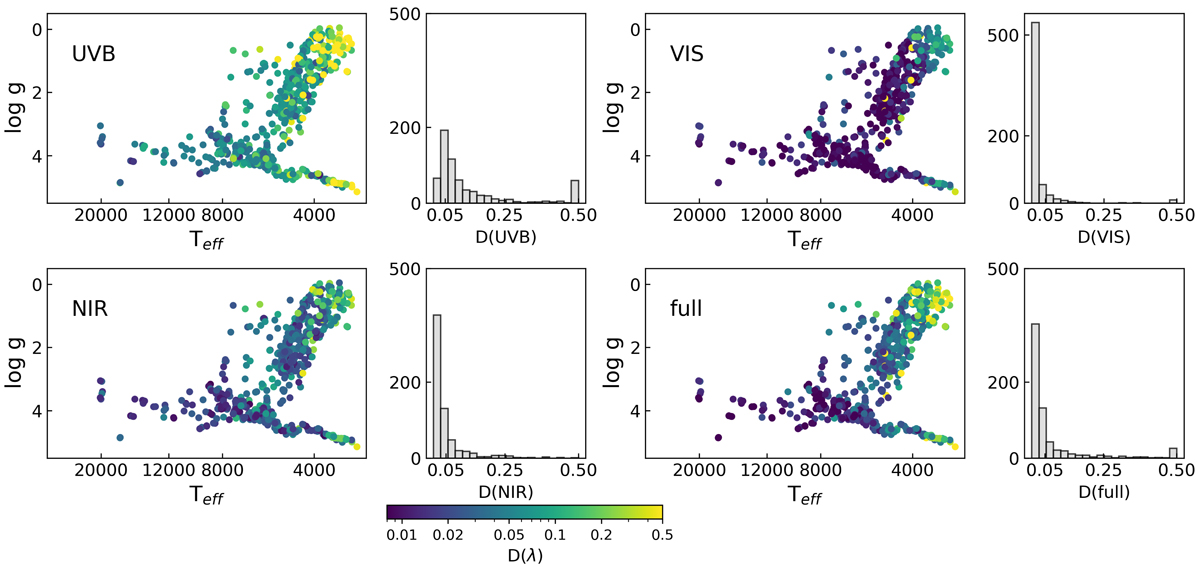
D-statistic comparing the interpolated and the XSL spectrum for the full wavelength range, and UVB, VIS, and NIR parts separately. The colour bar is logarithmic. Histograms show the distributions of D-statistic calculated within these spectral ranges at a resolving power of R = 500. For better visualisation, the D > 0.5 points are placed into the D = 0.5 bin on the histograms.
Current usage metrics show cumulative count of Article Views (full-text article views including HTML views, PDF and ePub downloads, according to the available data) and Abstracts Views on Vision4Press platform.
Data correspond to usage on the plateform after 2015. The current usage metrics is available 48-96 hours after online publication and is updated daily on week days.
Initial download of the metrics may take a while.