Free Access
Fig. 15.
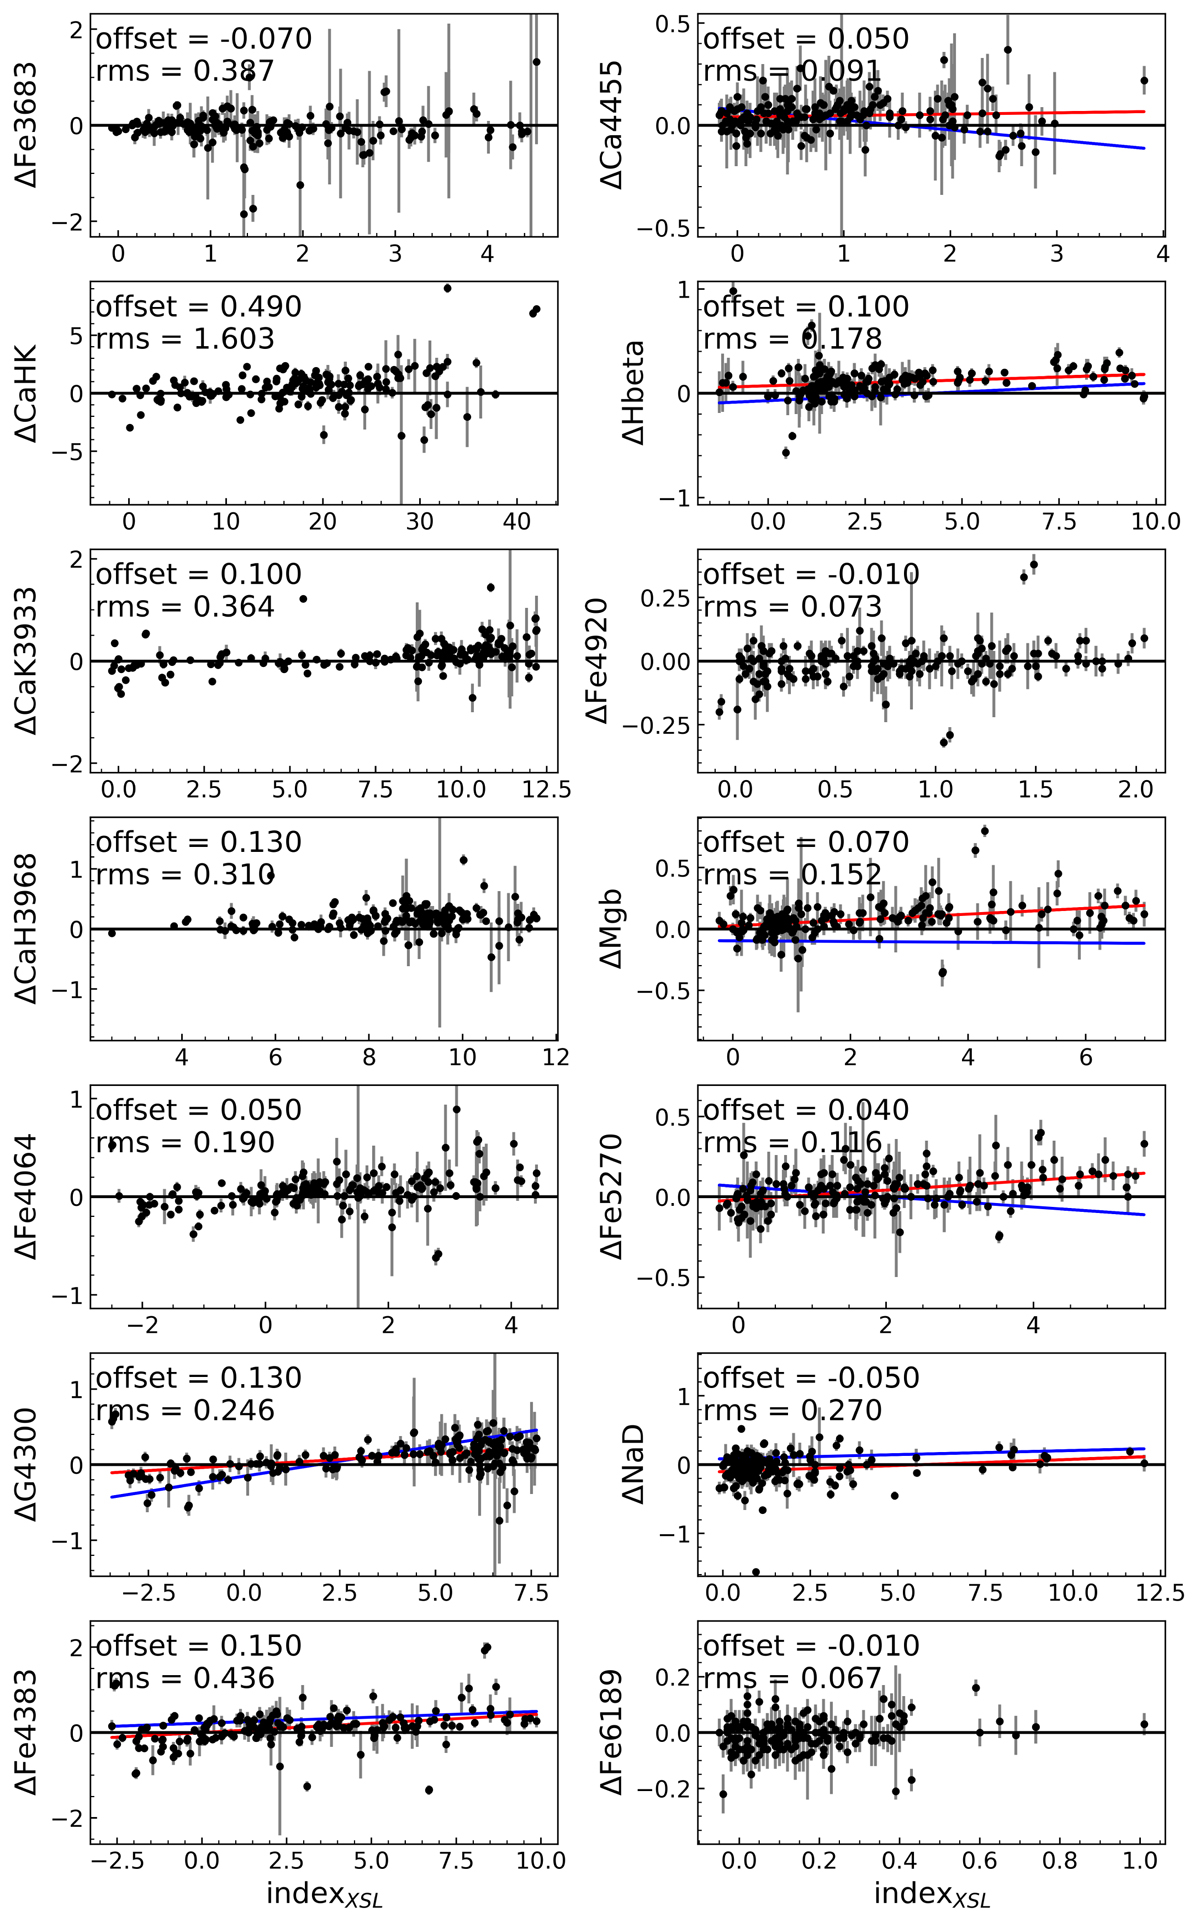
Download original image
Selection of 5 Å LIS indices measured from MILES and XSL spectra. Here, Δindex = indexXSL − indexMILES. The grey bars are uncertainties drawn from a Monte Carlo sampling of the XSL spectra. The blue lines in some panels are from Wang et al. (2018) and the red lines denote a linear fit to our data.
Current usage metrics show cumulative count of Article Views (full-text article views including HTML views, PDF and ePub downloads, according to the available data) and Abstracts Views on Vision4Press platform.
Data correspond to usage on the plateform after 2015. The current usage metrics is available 48-96 hours after online publication and is updated daily on week days.
Initial download of the metrics may take a while.