Fig. 11.
Download original image
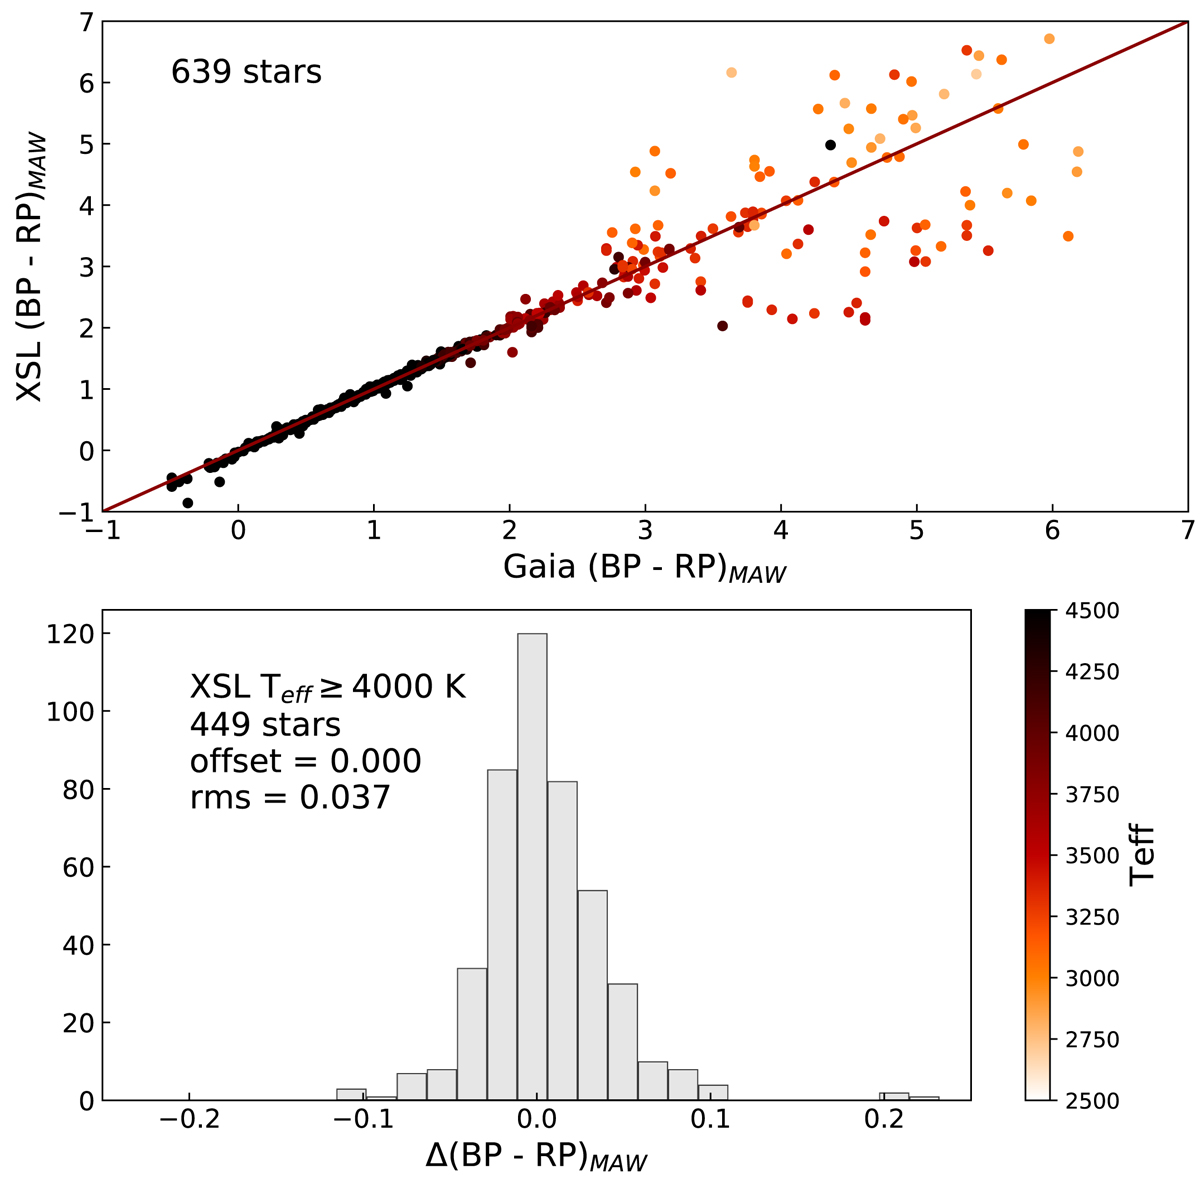
Differences between the published Gaia colours and XSL colours measured from the spectra. We use response curves for the Gaia photometric system presented by Maíz Apellániz & Weiler (2018, ‘MAW’ in the figure). We exclude stars with temperatures Teff < 4000 K and variable stars from the histogram and rms calculations, but they are still included in the colour-colour comparison for illustrative purposes.
Current usage metrics show cumulative count of Article Views (full-text article views including HTML views, PDF and ePub downloads, according to the available data) and Abstracts Views on Vision4Press platform.
Data correspond to usage on the plateform after 2015. The current usage metrics is available 48-96 hours after online publication and is updated daily on week days.
Initial download of the metrics may take a while.