Free Access
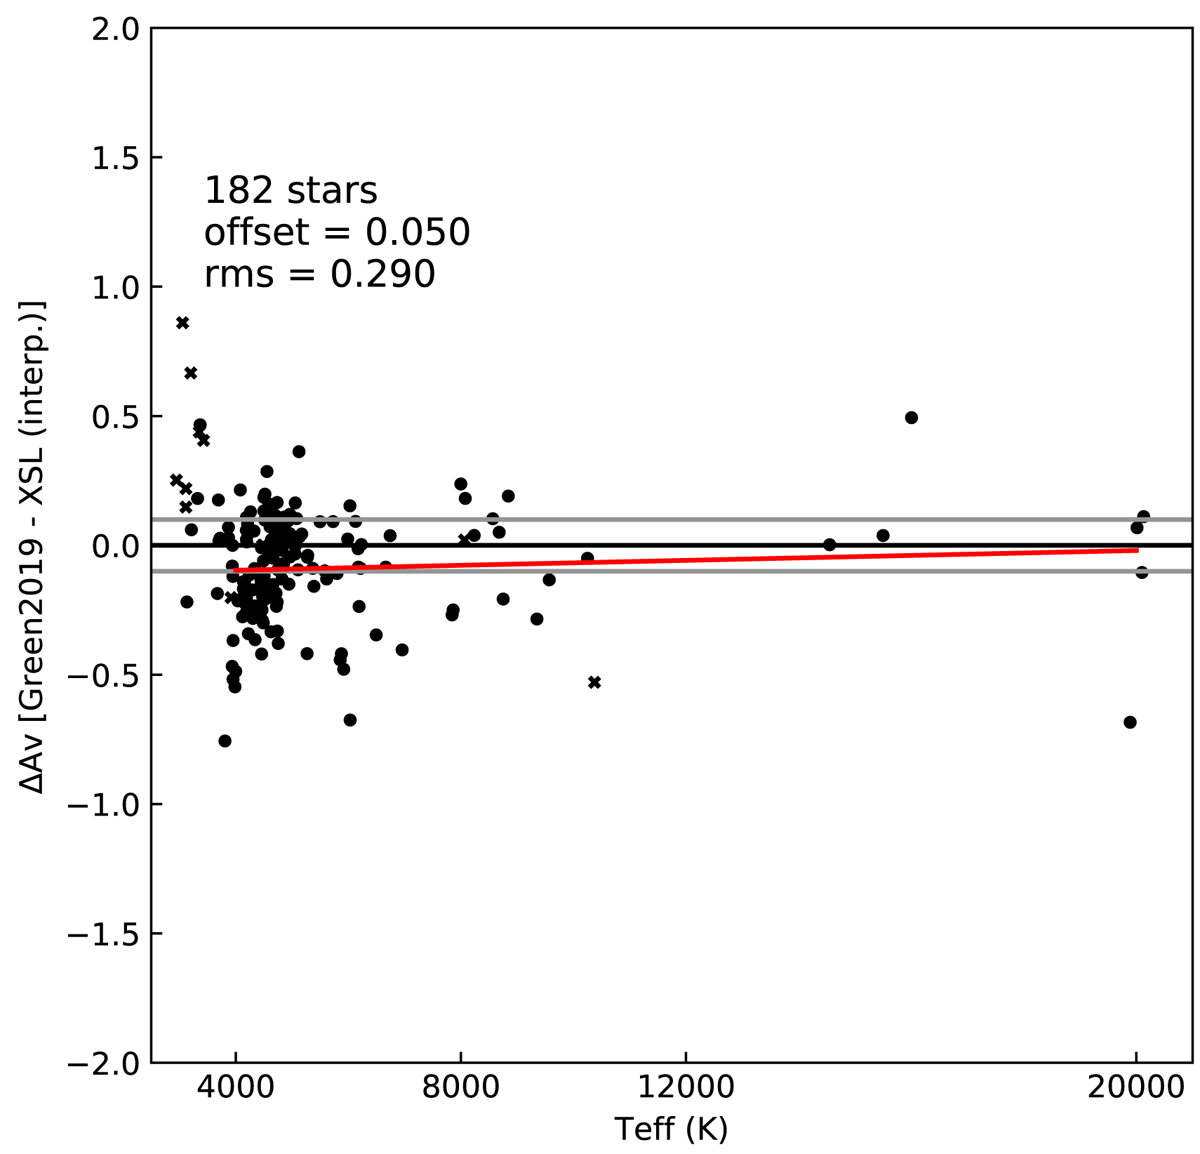
Fig. 10.
Download original image
Differences between our AV estimates and those from the Green et al. (2019) 3D dust maps. Stars with extinction values determined with our interpolator are marked with filled black circles, and those with L20 values are marked with black crosses. The red line denotes a linear fit to stars warmer than 4000 K.
Current usage metrics show cumulative count of Article Views (full-text article views including HTML views, PDF and ePub downloads, according to the available data) and Abstracts Views on Vision4Press platform.
Data correspond to usage on the plateform after 2015. The current usage metrics is available 48-96 hours after online publication and is updated daily on week days.
Initial download of the metrics may take a while.